- ads-COM
- Alaloop
- AOL
- Applabs Technologies Pvt.Ltd
- ARDAS group
- ARIS B.V.
- AtlantBH
- AtlantBH
- Cofman
- Consology (Pty) Ltd
- South Africa
- Corporate Express Australia Ltd.
- CSIRO
- DATACOM
- DataResolve Systems
- eBuilder Technology Centre
- eFusion
- Ephibian
- DiSiD Technologies
- Innopath Software
- Innominds
- kippdata informationstechnologie GmbH
- Lufthansa Systems Indonesia
- Neev Information Technologies
- orbitz
- Panter
- Pragmatic Test Labs
- PrepMe
- SharpMind
- Sourcepole
- Talis
- Teamwork Technology
- France
- WatchMouse
- Sapient
- xrow GmbH
- Infospectrum India Pvt. Ltd
- Merit Software and Services Pvt. Ltd
- Hexaware Technologies
Saturday, March 31, 2012
Companies that are using JMeter?
How to start JMeter?
Step1: Download the latest production release of JMeter
Download Link:
http://jakarta.apache.org/site/downloads/index.html
Or
\\Server\Location
Pre-requisites:
JMeter requires your computing environment meets some minimum requirements.
• JVM 1.4 or higher.
• Java path is set (e.g. C:\Program Files\Java\jdk1.5.0_06\bin)
Step2: Installation of JMeter
• Simply unzip the zip file into the directory where you want JMeter to be installed.
(C:\JmeterHome)
Step3: Running JMeter and building a Test Plan
• Click on jmeter.bat (for Windows) file in .\bin directory
• Then JMeter GUI should appear (Note: First time it can take few seconds to load)
What is Jmeter?What can I do with it?
The Apache JMeter desktop application is open source software, a 100% pure Java application designed to load test functional behavior and measure performance. It was originally designed for testing Web Applications but has since expanded to other test functions.
What can I do with it?
Apache JMeter may be used to test performance both on static and dynamic resources (files, Servlets, Perl scripts, Java Objects, Data Bases and Queries, FTP Servers and more). It can be used to simulate a heavy load on a server, network or object to test its strength or to analyze overall performance under different load types. You can use it to make a graphical analysis of performance or to test your server/script/object behavior under heavy concurrent load.
What is buffer and why buffers required?
CPU is processing process p1, in process p1 there is an instruction
'read opd.txt file'. then CPU gives this request to Device controller
(disk controller) then disk controller is reading the data from disk
and read data should placed in local 'Buffer' of the disk controller.
If some thing need to write then Data should be available in 'buffer' of the disk controller from that disk is reading. because CPU writes the data in massive rate but disk is very slow , so it is not possible to write the data in to disk due the speed. So CPU place the data into disk local buffers from that disk is reading.
If some thing need to write then Data should be available in 'buffer' of the disk controller from that disk is reading. because CPU writes the data in massive rate but disk is very slow , so it is not possible to write the data in to disk due the speed. So CPU place the data into disk local buffers from that disk is reading.
What is an IO?
IO is Input (reading data) or Output (writing data).
IO always between Disk and Disk controller. But not memory and Disk.
CPU is processing process p1, in process p1 there is an instruction 'read opd.txt file'. then CPU gives this request to Device controller (disk controller) then disk controller is reading the data from disk and read data should placed in local 'Buffer' of the disk controller.
If some thing need to write then Data should be available in 'buffer' of the disk controller from that disk is reading. because CPU writes the data in massive rate but disk is very slow , so it is not possible to write the data in to disk due the speed. So CPU place the data into disk local buffers from that disk is reading.
What is an interrupt
IO is always between device and device controller. CPU reads/write the data in Giga Hedge speed but disk are very slow , due to this disk looses some data during reading the data from CPU. So Disk controller has local buffers for solving this issue. First CPU place the data in to Disk buffers from that Disk reads. same thing for write also.
CPU is processing process p1, in process p1 there is an instruction 'read opd.txt file'. then CPU gives this request to Device controller (disk controller) then disk controller is reading the data from disk mean wile CPU should not Idle, CPU context switching to process p2 and process p1 is preempted . Once disk is finished reading the data from disk (and placed this data into disk controller), disk controller raises an interrupt to CPU "saying that ready is finished" at time P2 or P3 or P4 may running in CPU, then ISR executes and data is read from disk controller to memory.
This is called Hardware interrupt.
What is preemption or context switching
Device controller and CPU can work concurrently. All Devices like Hard disk, magnetic disks, Printers, Memory are dumb, means they won't work with out device controller.
If i want to read some file from Disk , Disk controller reads the data from disk to Disk controller buffer then it transfer to main memory. Then user is able to read the file.
CPU is processing process p1, in process p1 there is an instruction 'read opd.txt file'. then CPU gives this request to Device controller (disk controller) then disk controller is reading the data from disk mean wile CPU should not Idle and CPU context switching to process p2 and process p1 is preempted . This is Called Context switching.
Thursday, March 29, 2012
Entry citeria and Exit criteria for Performance testing?
Entry Criteria:
1.Functionally application should stable.
2.All functional testing should be passed..
Note: Before going to start performance testing above two conditions should passed.
Exit criteria:
1. Application should meet performance goals or SLA.
Uses of Doing Performance testing
IRCTC is an application of Rail way Dep (organization) and Central govt is the client. If we want to build an application, organization required
--Developers
-- Administrators( DB and Application server administrator).
--Network administrators and
--Architects majorly.
Finally end users(me,you ...etc) are using the applications. Here client( is earning the money because of using the application (IRCTC).
If
application is opening after 20 min , no end user will use the
application.This problem will solved by doing Performance testing before
releasing the application to the product.This is main use of doing
performance testing.
Other reasons are:
1. Finding development issues like
a. Memory leaks
b. Synchronization points
c. Slow queries ....etc.
2.Administrator issues like
a. High CPU Utilization
b. High Memory Utilization
c. Connection pool issues
d. Socket issues and ...etc.
3. Architecture issues like
a. Poor db design
b.Poor software identifications .. etc.
Wednesday, March 28, 2012
Capacity Planning
Overview
Capacity planning is the process of planning for growth and forecasting peak usage periods in order to meet system and application capacity requirements. It involves extensive performance testing to establish the application's resource utilization and transaction throughput under load. First, you measure the number of visitors the site currently receives and how much demand each user places on the server, and then you calculate the computing resources (CPU, RAM, disk space, and network bandwidth) that are necessary to support current and future usage levels. This How To describes two methodologies for capacity planning:
1.Transaction cost analysis. Transaction cost analysis calculates the cost of the most important user
operations of an application in terms of a limiting resource. The resource can be CPU, memory, disk,
or network. You can then identify how many simultaneous users can be supported by your hardware
configuration or which resource needs to be upgraded to support an increasing number of users and
by how much.
2. Predictive analysis. Predictive analysis forecasts the future resource utilization of your application
based on past performance. To perform predictive analysis, you must have historical data available
for analysis.
Note: The sample application referred to in this How To is not an actual application, and the data used is not based on any actual test results. They are used only to illustrate the concepts in the discussion.
Transaction Cost Analysis
The process of using transaction cost analysis for capacity planning consists of the following steps:
1.Compile a user profile: Compiling a user profile means understanding your business volumes and usage
patterns. Generally, you obtain usage information by analyzing log files.
2.Execute discrete tests: Execute tests on specific user operations based on the profiles created in the
previous step.
3.Measure the cost of each operation:Using the performance data captured in the previous step, calculate
the cost of each user operation.
4.Calculate the cost of an average user profile: Calculate the cost of an average user profile by assuming
fixed period of activity for an average user (for example, 10
minutes).
5.Calculate site capacity: Based on the cost of each user profile, calculate the maximum number of users
supported by the site.
6.Verify site capacity:Verify site capacity by running a script that reflects the user profile with an
increasing number of users and then comparing the results against those obtained
in previous steps.
The next sections describe each of these steps.
Step 1: Compile a User Profile
Compile a user profile from the existing production traffic data. The main resource for identifying user operations is the Internet Information Services (IIS) log files. The components extracted from usage profiles are as follows:
• A list of user profiles.
• The average duration of a user session.
• The total number of operations performed during the session.
• The frequency with which users perform each operation during the session.
To compile a user profile
1. Identify the number of user requests for each page and the respective percentages.
The number of user requests for each page can be extracted from the log files. Divide the number of requests for each page by the total number of requests to get the percentage.
Table 1: illustrates a sample profile.
Table 1: User Requests per Page
---------------------------------------------------------------------
ID URI Number of requests Percentages
---------------------------------------------------------------------
1 /MyApp/login.aspx 18,234 35%
2 /MyApp/home.aspx 10,756 20%
3 /MyApp/logout.aspx 9,993 19%
4 /MyApp/SellStock.aspx 4,200 8%
5 /MyApp/BuyStock.aspx 9,423 18%
----------------------------------------------------------------------
Total 52,606 100%
----------------------------------------------------------------------
2. Identify the logical operations and number of requests required to complete the operation.
A user operation can be thought of as a single complete logical operation that can consist of more than one request. For example, the login operation might require three pages and two requests. The total number of operations performed in a given time frame can be calculated by using the following formula:
Number of operations = Number of requests / Number of requests per operation
The Requests per operation column in Table 2 shows how many times the page was requested for a single operation.
Table 2: User Requests per Operation
-------------------------------------------------------------------------------------------------------
ID URI Number of requests Requests per operation Number of operations
-------------------------------------------------------------------------------------------------------
1 /MyApp/login.aspx 18,234 2 9,117
2 /MyApp/logout.aspx 9,993 1 9,993
3 /MyApp/SellStock.aspx 4,200 2 2,100
4 /MyApp/BuyStock.aspx 9,423 3 3,141
------------------------------------------------------------------------------------------------------
Total n/a 41,850 8 24,351
------------------------------------------------------------------------------------------------------
3.Identify the average user profile, session length, and operations per session. You can analyze the IIS log files to calculate the average user session length and the number of operations an average user performs during the session. The session length for the sample application was calculated as 10 minutes from the IIS logs, and the average user profile for the sample application is shown in Table 3.
Table 3: Average User Profile
----------------------------------------------------------------------------------
Operation Number of operations executed
during an average session
-----------------------------------------------------------------------------------
Login 1
SellStock 3
BuyStock 2
Logout 1
---------------------------------------------------------------------------------
For more information about identifying user profiles, see "Workload Modeling" in Chapter 16, "Testing .NET Application Performance."
Step 2: Execute Discrete Tests
Run discrete tests for each user operation identified in Step 1 for a load at which your system reaches maximum throughput. For example, you need to run separate tests for Login, BuyStock, and SellStock operations. The test script only fires the requests for a dedicated user operation.
The procedure for executing the tests consists of the following tasks:
•Set up the environment with the minimum number of servers possible. Make sure that the architecture of
your test setup mirrors your production environment as closely as possible.
•Create a test script that loads only the operation in consideration without firing any redundant requests.
•Define the point at which your system reaches maximum throughput for the user profile. You can identify
this point by monitoring the ASP.NET Applications\ Requests/Sec counter for an ASP.NET application
when increasing the load on the system. Identify the point at which Requests/Sec reaches a maximum
value.
•Identify the limiting resource against which the cost needs to be calculated for a given operation. List the
performance counters you need to monitor to identify the costs. For example, if you need to identify the
cost of CPU as a resource for any operation, you need to monitor the counters listed in Table 4.
----------------------------------------------------------------------------
Object Counter Instance
---------------------------------------------------------------------------
Processor % Processor Time _Total
ASP.NET Applications Requests/Sec Your virtual directory
-----------------------------------------------------------------------------
Note Requests/Sec will be used to calculate the processor cost per request.
•Run load tests for a duration that stabilizes the throughput of the application. The duration can be
somewhere between 15 to 30 minutes. Stabilizing the throughput helps create a valid, equal
distribution of the resources over a range of requests.
Output
The output from executing this series of steps for each scenario would be a report like the following:
Number of CPUs = 2
CPU speed = 1.3 GHz
Table 5 shows a sample report for the results of the load tests.
Table 5: Load Test Results
----------------------------------------------------------------------------------------------------
User operation Process\% Processor Time ASP.NET Applications\Requests/Sec
----------------------------------------------------------------------------------------------------
Login 90% 441
SellStock 78% 241
BuyStock 83% 329
Logout 87% 510
---------------------------------------------------------------------------------------------------
Step 3: Measure the Cost of Each Operation
Measure the cost of each operation in terms of the limiting resource identified in Step 2. Measuring the operation cost involves calculating the cost per request and then calculating the cost per operation. Use the following formulas for these tasks:
•Cost per request: You can calculate the cost in terms of processor cycles required for processing a request by using the following formula:
Cost (Mcycles/request) = ((number of processors x processor speed) x processor use) / number of requests per second
For example, using the values identified for the performance counters in Step 2, where processor speed is 1.3 GHz or 1300 Mcycles/sec, processor usage is 90 percent, and Requests/Sec is 441, you can calculate the page cost as:
((2 x 1,300 Mcycles/sec) x 0.90) / (441 Requests/Sec) = 5.30 Mcycles/request
•Cost per operation: You can calculate the cost for each operation by using the following formula:
Cost per operation = (number of Mcycles/request) x number of pages for an operation
The cost of the Login operation is:
5.30 x 3 = 15.9 Mcycles
If you cannot separate out independent functions in your application and need one independent function as a prerequisite to another, you should try to run the common function individually and then subtract the cost from all of the dependent functions. For example, to perform the BuyStock operation, you need to perform the login operation, calculate the cost of login separately, and then subtract the cost of login from the cost of the BuyStock operation.
Therefore the cost of a single BuyStock operation can be calculated as follows:
Single cost of BuyStock operation = Total cost of BuyStock – Cost of Login operation
The cost of a single BuyStock operation is:
39.36 – 15.92 = 23.44 Mcycles
Table 6 shows the cost of each user operation in a sample application using the following scenario.
CPU Speed = 1300 MHz
Number of CPUs = 2
Overall CPU Mcycles = 2,600
Table 6: Cost per Operation for Login, SellStock, BuyStock, and Logout Operations
----------------------------------------------------------------------------------------------------------------------------------
User CPU % Total net ASP.NET Number Operation #pages cost of
Operation Utilization CPU Mcycles Requests/Sec of Requests Cost(Mcycles) without single operation
login
-----------------------------------------------------------------------------------------------------------
Login 90% 2,340.00 441 3 15.92 3 15.92
SellStock 78% 2,028.00 241 5 42.07 2 26.16
BuyStock 83% 2,158.00 329 6 39.36 3 23.44
Logout 87% 2,262.00 510 5 22.18 2 6.26
----------------------------------------------------------------------------------------------------------------------------------
The operation cost needs to be measured separately for each tier of an application.
Step 4: Calculate the Cost of an Average User Profile
The behavior of actual users can cause random crests and troughs in resource utilization. However, over time these variations even out statistically to average behavior. The user profile you compiled in Step 1 reflects average user behavior. To estimate capacity, you need to assume an average user and then calculate the cost in terms of the limiting resource identified in Step 2.
As shown in Table 7, during a ten-minute session, an average user needs 147.52 Mcycles of CPU on the server. The cost per second can be calculated as follows:
Average cost of profile in Mcycles/sec = Total cost for a profile / session length in seconds
Thus, the average cost for the profile shown in Table 7 is:
147.52/600 = 0.245 Mcycles/sec
This value can help you calculate the maximum number of simultaneous users your site can support.
Table 7: Cost of an Average User Profile
-----------------------------------------------------------------------------------------------------------------------------
Average User Profile Number of operations Cost per operation Total cost per operation
executed during an (Mcycles) (Mcycles)
average session
--------------------------------------------------------------------------------------------------------
Login 1 15.92 15.92
SellStock 3 26.16 78.47
BuyStock 2 23.44 46.87
Logout 1 6.26 6.26
--------------------------------------------------------------------------------------------------
Total 147.52
---------------------------------------------------------------------------------------------------------
Step 5: Calculate Site Capacity
Calculating site capacity involves knowing how many users your application can support on specific hardware and what your site's future resource requirements are. To calculate these values, use the following formulas:
•Simultaneous users with a given profile that your application can currently support. After you determine the cost of the average user profile, you can calculate how many simultaneous users with a given profile your application can support given a certain CPU configuration. The formula is as follows:
Maximum number of simultaneous users with a given profile = (number of CPUs) x (CPU speed in Mcycles/sec) x (maximum CPU utilization) / (cost of user profile in Mcycles/sec)
Therefore, the maximum number of simultaneous users with a given profile that the sample application can support is:
(2 x 1300 x 0.75)/0.245 = 7,959 users
•Future resource estimates for your site. Calculate the scalability requirements for the finite resources that need to be scaled up as the number of users visiting the site increases. Prepare a chart that gives you the resource estimates as the number of users increases.
Based on the formulas used earlier, you can calculate the number of CPUs required for a given number of users as follows:
Number of CPUs = (Number of users) x (Total cost of user profile in Mcycles/sec) / (CPU speed in MHz) x (Maximum CPU utilization)
If you want to plan for 10,000 users for the sample application and have a threshold limit of 75 percent defined for the processor, the number of CPUs required is:
10000 x 0.245 / (1.3 x 1000) x 0.75 = 2.51 processors
Your resource estimates should also factor in the impact of possible code changes or functionality additions in future versions of the application. These versions may require more resources than estimated for the current version.
Step 6: Verify Site Capacity
Run the load tests to verify that the transaction cost analysis model accurately predicts your application capacity and future requirements.
Verify the calculated application capacity by running load tests with the same characteristics you used to calculate transaction cost analysis. The verification script is simply a collection of all transaction cost analysis measurement scripts, aggregated and run as a single script.
The actual values and the estimated values should vary by an acceptable margin of error. The acceptable margin of error may vary depending on the size of the setup and the budget constraints. You do not need to run load tests each time you perform transaction cost analysis. However, the first few iterations should confirm that transaction cost analysis is the correct approach for estimating the capacity of your application.
Predictive Analysis
Predictive analysis involves the following steps:
1.Collect performance data:Collect performance data for the application in production over a period of
time.
2.Query the existing historical data:Query the historical data based on what you are trying to analyze or
predict.
3.Analyze the historical performance data:Use mathematical equations to analyze the data to
understand the resource utilization over a period of time.
4.Predict the future requirements:Predict the future resource requirements based on the mathematical
model prepared in Step 2.
The next sections describe each of these steps.
Step 1: Collect Performance Data
The performance data for the application needs to be collected over a period of time. The greater the time duration, the greater the accuracy with which you can predict a usage pattern and future resource requirements.
The performance counters and other performance data to be collected are based on your performance objectives related to throughput, latency, and resource utilization. The performance counters are collected to verify that you are able to meet your performance objectives and your service level agreements. For information about which counters to look at, see Chapter 15, "Measuring .NET Application Performance."
Be careful not to collect more than the required amount of data. Monitoring any application incurs overhead that may not be desirable beyond certain levels for a live application.
You might further instrument the code to analyze custom performance metrics. One of the tools available for storing and analyzing this performance data in large quantities is Microsoft Operations Manager (MOM).
Step 2: Query the Existing Historical Data
Query the historical data based on what you are trying to analyze. If your application is CPU bound, you might want to analyze CPU utilization over a period of time. For example, you can query the data for the percentage of CPU utilization for the last 40 days during peak hours (9:00 A.M.–4:00 P.M.), along with the number of connections established during the same period.
Step 3: Analyze the Historical Performance Data
Before you analyze the historical performance data, you must be clear about what you are trying to predict. For example, you may be trying to answer the question, "What is the trend of CPU utilization during peak hours?"
Analyze the data obtained by querying the database. The data obtained for a given time frame results in a pattern that can be defined by a trend line. The pattern can be as simple as a linear growth of the resource utilization over a period of time. This growth can be represented by an equation for a straight line:
y = mx + b
where b is the x offset, m is the slope of the line, and x is an input. For the preceding question, you would solve for x given y:
x = (y – b)/m
For the example in Step 1, the trend line is:
y = 0.36x + 53
where y is the CPU utilization and x is the number of observations. Figure 1 shows the trend for this example.
 |
| Figure 1: Trend of CPU utilization |

Choosing the correct trend line is critical and depends on the nature of the source data. Some common behaviors can be described by polynomial, exponential, or logarithmic trend lines. You can use Microsoft Excel or other tools for trend line functions for analysis.
Step 4: Predict Future Requirements
Using the trend lines, you can predict the future requirements. The predicted resource requirements assume that the current trend would continue into the future.
For example, consider the trend line mentioned in Step 3. Assuming you do not want the CPU utilization to increase beyond 75 percent on any of the servers, you would solve for x as follows:
x = (y – 53)/0.36
Therefore:
x = (75 – 53)/0.36 = 61.11
Based on the current trends, your system reaches 75 percent maximum CPU utilization when x = 61.11. Because the x axis shows daily measurements taken from the peak usage hours of 9:00 A.M. to 4:00 P.M., one observation corresponds to one day. Because there are 40 observations in this example, your system will reach 75 percent CPU utilization in the following number of days:
61.11 – 40 = 21.11
Tuesday, March 27, 2012
Questioners for performance testing requirement gathering
Check list for performance testing requirements gathering ?
Requirement gathering is very import for any project , for making this phase success . Ask the below Questions to your client or BA (Business analyst) or send a mail with the below questions. Please find the requirement gathering Questioners below
Requirement gathering is very import for any project , for making this phase success . Ask the below Questions to your client or BA (Business analyst) or send a mail with the below questions. Please find the requirement gathering Questioners below
Wednesday, March 21, 2012
Performance Testing Approach
Monday, March 19, 2012


Sunday, March 18, 2012
Too many files opened issue
How to solve too many files issue?
This issue occur in two areas
1. If Web server, App server and Data base servers residing in One machine, then you m ayget this error
2. If socket timed out not mentioned then this issue may this issue.
Using ulimit -a command, we will find how many sockets had that machine. In any machine 1024 is the maximum sockets.
Bottleneck identification:
Using netstat -a|grep WAIT|wc -l command we will find how many sockets opened by the application. If 1024 connection are utilized then we will get too many open files.
If you want know which server opened more socket, just use lsof -p <Process ID> for finding the sockets opened by that process.
Internal Process of a socket: All HTTP requests internally used TCP connection. One TCP connection is one Socket in computer science language. So if you send n number of requests to the server , the server opens the socket to handle your requests but we need to close the sockets once your request got over other wise socket won't close, for this we need to mention the socket timed out.
Solutions:
For issue 1: Just increase the sockets using ulimit -Hn <Parameter> (Ex ulimit -Hn 2048)command, but it is not recommended , you have to discuss with your architect on this.
For issue 2: Just provide the socket time out in your server configuration file. In web server change the value in uri_worker.property file
Where web server residing in any Application architecture?
Web server always residing before the Application server. The request flow from client to server shown below
Client-->Web server --->Application server ---->Data base Server.
1.Client sends the request to the server
2.web server takes the request from the client,if the request has business logic then using load balancing request will goes to the Application server
3.Request will goes to DB server using the connection pool configuration.
How HTTP request passes through OSI layers for communicating the web server?
In this way, HTTP is the top layer in a "protocol stack" of "HTTP over TCP over IP," as depicted in Figure shown below. A secure variant, HTTPS, inserts a cryptographic encryption layer (called TLS or SSL) between HTTP and TCP .
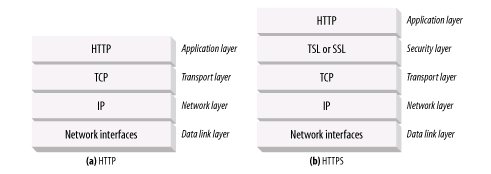
HTTP Request Vs ISO layers
When HTTP wants to transmit a message, it streams the contents of the message data, in order, through an open TCP connection. TCP takes the stream of data, chops up the data stream into chunks called segments, and transports the segments across the Internet inside envelopes called IP packets . This is all handled by the TCP/IP software; the HTTP programmer sees none of it.
Friday, March 16, 2012
Performance Testing and How to identify performance objectives?
Performance Testing:
Finding the application behavior with respective of
|--Response Time
|--Throughput
|--CPU Utilization ..... (Above 3 values may change depending upon the Client requirement).
Before going to start Performance testing, performance tester required NFR(Non function requirement)/SLA( Service Level Agreement)/Performance Objectives,why we required because with out knowing objective nothing to do.
Ex: My teacher told "Go That District", this is meaning less. So teacher need to tell " GO Hyderabd". Then it is very easy to do this. So we required objectives. what NFR/SLA document contains is Objectives.
Below are the Objectives for Performance Testing.
1. Number of users the application needs to support (Ex: 1000 users need to support)
2. Response time (Ex:less than 8 sec for all pages)
3.CPU Utilization (Ex: less than 80%)
4. Memory Utilization (Ex: less than 80%).
Note:
1. We can call all above 4 as SCOPE of application
2. Some time Functional test plan contains NFR details. Some times client/Manager will give separate NFR document.
3. NFR document contain performance related information and Security testing related ..... e.t.c.
IRCTC is an application of Rail way Dep (organization) and Central govt is the client. If we want to build an application, organization required
--Developers
-- Administrators( DB and Application server administrator).
--Network administrators and
--Architects majorly.
Finally end users(me,you ...etc) are using the applications. Here client( is earning the money because of using the application (IRCTC).
1. Finding development issues like
a. Memory leaks
b. Synchronization points
c. Slow queries ....etc.
2.Administrator issues like
a. High CPU Utilization
b. High Memory Utilization
c. Connection pool issues
d. Socket issues and ...etc.
3. Architecture issues like
a. Poor db design
b.Poor software identifications .. etc.
Functional testing should over and Build should stable for doing performance testing.
Finding the application behavior with respective of
|--Response Time
|--Throughput
|--CPU Utilization ..... (Above 3 values may change depending upon the Client requirement).
Before going to start Performance testing, performance tester required NFR(Non function requirement)/SLA( Service Level Agreement)/Performance Objectives,why we required because with out knowing objective nothing to do.
Ex: My teacher told "Go That District", this is meaning less. So teacher need to tell " GO Hyderabd". Then it is very easy to do this. So we required objectives. what NFR/SLA document contains is Objectives.
Below are the Objectives for Performance Testing.
1. Number of users the application needs to support (Ex: 1000 users need to support)
2. Response time (Ex:less than 8 sec for all pages)
3.CPU Utilization (Ex: less than 80%)
4. Memory Utilization (Ex: less than 80%).
Note:
1. We can call all above 4 as SCOPE of application
2. Some time Functional test plan contains NFR details. Some times client/Manager will give separate NFR document.
3. NFR document contain performance related information and Security testing related ..... e.t.c.
What is the Use of Doing Performance testing?
IRCTC is an application of Rail way Dep (organization) and Central govt is the client. If we want to build an application, organization required
--Developers
-- Administrators( DB and Application server administrator).
--Network administrators and
--Architects majorly.
Finally end users(me,you ...etc) are using the applications. Here client( is earning the money because of using the application (IRCTC).
If application is opening after 20 min , no end user will use the application.This problem will solved by doing Performance testing before releasing the application to the product.This is main use of doing performance testing.
Other reasons are:
1. Finding development issues like
a. Memory leaks
b. Synchronization points
c. Slow queries ....etc.
2.Administrator issues like
a. High CPU Utilization
b. High Memory Utilization
c. Connection pool issues
d. Socket issues and ...etc.
3. Architecture issues like
a. Poor db design
b.Poor software identifications .. etc.
When was performance testing starts?
Functional testing should over and Build should stable for doing performance testing.
Types of Performance Testing and which testing are followed by another testing.
For any application , it is recommended to do below performance testings
1. Base line test followed by
2. Bench mark test followed by
3. Load testing followed by
4. Stress testing followed by
5. Endurance Testing/Longevity Testing/Soak testing. We have other performance testings but these testing may/may not required
6.Spike Testing.
Note: SLA/NFR document says application needs to support with 1000 users, this is objective and Response time should be < 8 sec and CPU and Memory Utilization should be < 80%.
Base line Test: Baseline testing is nothing but one user test.
Why Base line test require/why it is important?
1.which will help to identify the correctness of the test scripts and
2.check whether the application meets the SLAs (Is response tine is <8 sec and CPU and Memory Utilization are < 80%, if not raise a Bug in bug tracking tool and send a mail to manager/Lead by saying "Need to analyse the results", if yes go for benchmark testing and send the results to entire team) for a one-user load.
Below are the Performance engineering tasks:
In result analysis, if loadrunner used, check the server time if is higher (>5sec) then need to tune the queries and code. if server time is <1 sec then use response break down graphs(or go for Dynatrace Ajax tool), then find out the reason for that. i.e
1. Check Image sizes and Downloaded time
2. Check the caches (Short term cache or Long term cache)
3. DOM time
4. DNS resolution time and Wait time.
5. Java script execution time and which method is causing the issue in that script.... etc.
These values can be used a benchmark for newer versions to compare performance improvements.
Note: Insert 5 iterations in your script for result consistency in Base line test.It is recommended.
Benchmark Test: Test for at least 15–20% of the target load.
Why Base line test require/why it is important?
1.Benchmark testing helps to identify the correctness of the test scripts and
2.Tests the readiness of the system before running target load tests, otherwise servers may crash, then it is very expensive.
3.check whether the application meets the SLAs (Is response tine is <8 sec and CPU and Memory Utilization are < 80%, if not raise a Bug in bug tracking tool and send a mail to manager/Lead by saying "Need to analyse the results", if yes go for Load Test and send the results to entire team).
These values can be used a benchmark for newer versions to compare performance improvements.
Load Testing: Finding the application behavior/Testing the application with expected(100% load) load.
Don't test directly with 100% users. Because your server may crash. So start with 25% ,30%,40%,50%,75%,90% and 100% (you can go with your own numbers , it is just examples).
Why Base line test require/why it is important?
If your application meets SLA for 25% users then go for 30% otherwise raise bug and send a mail stating that " Application may support with 25% (Ex:250 users, because our goal is test with 1000 users,so 25% means 250) needs to tune the application", even share the results with all the team.Then development team/ Architect tuned the application start with 25% load, if it meet go for 30%.
Continue the same process for 30%,40%,50%,75%,90% and 100%.
Note: 3 rounds of load test required for 25% ,30%,40%,50%,75%,90% and 100%.
Stress testing:Find application behavior/Testing the application beyond the Expected load.
Don't test directly with bigger number (like 125%), go with 110% and validate the SLA, then go with 125% validate the SLA. Test the application up to SLA not met and send the report for analysis. Then send the mail as well report to the manager, this is the Capacity of the application.
Why Base line test require/why it is important?
1. The maximum number of users supported.
2. Easy to determine Short term memory leaks.
3. Easy to determine configuration issues (Like min spare , Max spare, Max client, connection timed out issues)
4. Easy to find breaking point.
Endurance Testing/Longevity Testing/Soak testing : Testing the application with expected load for longer duration(like 12 to 18 hours).
Test directly with expected load (100% load) for 12 hours.
This test is very important and mandatory before releasing the build to production, by doing this test we can find
1. Long term memory leak
2. We can find configuration issues(socket timed out, connection timed out ... etc)
3.JVM Heap size utilization issues
4. AJB connection and connection timed out issues
5. DB Connection leaks
6. DB Cursor leaks
7. DB process leaks ..... etc.
Spike testing: Testing the application by suddenly increasing the loads.
Monday, March 5, 2012
Causes for websites slow?
1. A client first needs to determine the IP address and port number of the web server from the URI. If the hostname in the URI was not recently visited, it may take tens of seconds to convert the hostname from a URI into an IP address using the DNS resolution infrastructure.
Luckily, most HTTP clients keep a small DNS cache of IP addresses for recently accessed sites. When the IP address is already "cached" (recorded) locally, the lookup is instantaneous. Because most web browsing is to a small number of popular sites, hostnames usually are resolved very quickly.
2. Next, the client sends a TCP connection request to the server and waits for the server to send back a connection acceptance reply. Connection setup delay occurs for every new TCP connection. This usually takes at most a second or two, but it can add up quickly when hundreds of HTTP transactions are made.
3. Once the connection is established, the client sends the HTTP request over the newly established TCP pipe. The web server reads the request message from the TCP connection as the data arrives and processes the request. It takes time for the request message to travel over the Internet and get processed by the server.
4. The web server then writes back the HTTP response, which also takes time.
The magnitude of these TCP network delays depends on hardware speed, the load of the network and server, the size of the request and response messages, and the distance between client and server. The delays also are significantly affected by technical intricacies of the TCP protocol.
Subscribe to:
Posts (Atom)