Monday, May 7, 2012
How to configure Heap size in Web sphere app server
We can change WAS heap size in two ways
1. GUI
2. Command Prompt
GUI:
To set the JVM heap size:
1. Start the WebSphere Application Server administrative console.
2. Navigate to Servers > Application servers > server1 > Java and Process Management > Process Definition > Java Virtual Machine. server1 is the name of the server where you are deploying InfoSphere™ Master Content.
3.Set the initial and maximum heap sizes:
Initial Heap Size:
Maximum Heap Size:
Note: By default these values are in MB
Non GUI:
1. Navi gate to IBM_HOME\WebSphere\AppServer\profiles\AppSrv01\config\cells\server.xml
2. Then look for the “jvmEntries” xml element that could look like this:
<jvmEntries xmi:id=”JavaVirtualMachine_1183122130078″ verboseModeClass=”false” verboseModeGarbageCollection=”false” verboseModeJNI=”false” initialHeapSize=”512″ runHProf=”false” debugMode=”false” debugArgs=”-agentlib:jdwp=transport=dt_socket,server=y,suspend=n,address=7777″ disableJIT=”false”>
3. Change the initialHeapSize and maximumHeapSize
1. GUI
2. Command Prompt
GUI:
To set the JVM heap size:
1. Start the WebSphere Application Server administrative console.
2. Navigate to Servers > Application servers > server1 > Java and Process Management > Process Definition > Java Virtual Machine. server1 is the name of the server where you are deploying InfoSphere™ Master Content.
3.Set the initial and maximum heap sizes:
Initial Heap Size:
Maximum Heap Size:
Note: By default these values are in MB
Non GUI:
1. Navi gate to IBM_HOME\WebSphere\AppServer\profiles\AppSrv01\config\cells\server.xml
2. Then look for the “jvmEntries” xml element that could look like this:
3. Change the initialHeapSize and maximumHeapSize
How to configure Heap size in Jboss app server
For running JAVA applications in Jboss application server , need to specify the min and max memory for that Application server this sizing is called Heap size.
run.conf contains min and Max heap size. This file is located in bin folder of JBOSS i.e. JBOSS_HOME/bin
run.conf contains min and Max heap size. This file is located in bin folder of JBOSS i.e. JBOSS_HOME/bin
Thursday, May 3, 2012
JVM Heap Sizes max Limit for Windows and Linux/Unix.
For running JAVA code, We need JVM. Typically We can set the JVM sizes in Application servers. This JVM size is also called Heap Size.
JVM heap size Configuration file:
File_Name Location Server_Name OS_Name 64/32 Bit Processor Heap Sise_Max
-------------------------------------------------------------------------------------------------------
run.conf JBOSS_HOME/bin JBOSS Windows 32 1.4G to 1.6G
run.conf JBOSS_HOME/bin JBOSS Windows 64 3G
run.conf JBOSS_HOME/bin JBOSS Sun Solaris 32 2G
run.conf JBOSS_HOME/bin JBOSS Sun Solaris 64 4G
run.conf JBOSS_HOME/bin JBOSS Unix/Linux 32 2G
run.conf JBOSS_HOME/bin JBOSS Unix/Linux 64 4G
------------------------------------------------------------------------------------------------------------------------------
catalena.sh TOMCAT_HOME/bin TOMCAT Windows 32 1.4G to 1.6G
catalena.sh TOMCAT_HOME/bin TOMCAT Windows 64 3G
catalena.sh TOMCAT_HOME/bin TOMCAT Sun Solaris 32 2G
catalena.sh TOMCAT_HOME/bin TOMCAT Sun Solaris 64 4G
catalena.sh TOMCAT_HOME/bin TOMCAT Unix/Linux 32 2G
catalena.sh TOMCAT_HOME/bin TOMCAT Unix/Linux 64 4G
-----------------------------------------------------------------------------------------------------
server.xml See below note1 Web Sphere Windows 32 1.4G to 1.6G
server.xml See below note1 Web Spher Windows 64 3Gserver.xml See below note1 Web Sphere Sun Solaris 32 2G
server.xml See below note1 Web Sphere Sun Solaris 64 4G
server.xml See below note1 Web Sphere Unix/Linux 32 2GBserver.xml See below note1 Web Sphere Unix/Linux 64 4G
Note:For Web Sphere Location is in Command Prompt: <TWS_home>/appserver/profiles/twsprofile/config/cells/ DefaultNode/nodes/DefaultNode/servers/server1/server.xml
For Web Sphere Location is in UI : Application servers > server1 > Java and Process Management > Process Definition >Java Virtual Machine
Monday, April 30, 2012
What is 90 percentile
90 percentile is average of 90% of the response times, here arrange the 100 response times from good to bad then eliminate the worst 10% of the response times. Then calculate the average for 90% of the response times.
Example: The response times for an application for 10 users is
2,4,3,8,9,16,6,8,3,10 then arrange them from Good to bad
2,3,3,4,6,8,8,9,10,16
Then take the average for 90% of the response times 2,3,3,4,6,8,8,9,10 (eliminate the 16) is 5.88.
Overall (100%) response time is 10.94
Why 90 percentile required:
End users need to satisfy with the application response time / speed. Then users should increase other wise users won't use that application. For satisfaction calculation purpose Performance testers uses the 90 percentile. Means 90% of the users satisfying with that response time, remaining 10% users not satisfying with that response times.
Monday, April 23, 2012
Performance test plan template
Please find the performance test plan template in following link performance-test-plan-Template
Thursday, April 19, 2012
Check list for performance testing scripting
For making script reusable, error free and easy to understand, performance tester need to follow scripting standards. Due to this test can eliminate the scripting errors
Performance Test Plan
Tuesday, April 17, 2012
Entry&Exit criteria for performance testing and Entry&Exit criteria for performance execution phase
For any application the Entry criteria and Exit criteria may same.Because if application is not satisfying the performance objectives or goals then performance testing should not complete for any project like this with out (entry criteria) performance goals it is not possible to start the performance testing for any project.
Without performance goals doing performance testing is use less.
Performance testing Entry and Exit criteria:
Entry Criteria: Well defined SLA/Performance Objectives/Performance Goals
Exit Criteria: All performance SLA/Performance Objectives/Performance Goals should be met.
Performance Execution phase Entry and Exit criteria:
Entry Criteria: 1. Build/application should be stable (stable means functionality should be well and good, not functionality bugs should exits)
2.Performance testing environment should be ready
3.Scripts should be ready
Exit Criteria:Performance execution should be finished with out any transaction failures.
Thursday, April 5, 2012
Tell about your self.
1) Tell about your self?
Ans:
About my Experience:This is Madhu sudhana, have 7 years of experience in Performance Testing and Manual testing, 4.6 years of experience in area of Load runner , 3.2 years of experience in Performance engineering, 2 years of experience in Web server and Application server tuning and 1 year of experience in DB tuning.
About my current Project: I am now working XXX project from 2011 Feb to till. This project need to support 10,000 users and performance oblectives are response time shoulod be < 4 sec, Hits per second should be 18 hits/sec, CPU and memory utilization should be < 80%.
Roles & Responsibilities :
Role is Lead engineer
Responsibilities are
In my company performance testing approach is as follows
Step 1: We will send the project proposal to client once client satisfied we will get the project (in this phase my manager and lead involves)
Step 2: We will gather the requirements from client, here requirements means total number of users the application needs to support, response times, Hits per second, CPU utilization and Memory utilization.
If client does not provided this we can go with industry standards like Response time should be < 6 sec and CPU and Memory utilization should be < 80%.
Step 3: Identify the Business transactions (Gmail business transactions are login, inbox, compose mail, log out these are all transactions) and
Work load Models (How user doing navigation in that Gmail, Ex: Login (1 time)-->Inbox (8 times, means in average every users check 8 mails so insert the loop/iterations here instead of creating script for 8 times mail checking)-->Compose mail (5 times)--> logout (1 time)).
Identifying business transactions are 3 ways:
1.Client will give business transactions and work load models , if not below 2 ways need to follow
2. If the Application is in Production --> Identifying business transactions and work load models from logs: How?
In my project we are using Apache Http server as web server, we are taking 6 months access_logs from apache and Parsing the logs using 123logAnalyser and DeepLogAnalyser. From that we are taking most used transactions and Work load models.
3.If the Application is in not in Production -->For Identifying business transactions and work load models we are using 2 Techniques
a. Heavy throughput : Transaction which are handling more data(like searching , opening email)/transaction which are getting more data from the server and displaying them in browser.
b. Machine Critical techniques: Tracsction which are critical to the application (like Deposit, Withdraw,Composing mail, Pay bills......)
Step4: Creating the script for identified transactions (identified transactions in step 3) and Creating the scenarios(see the scenarios in following linkhttp://madhuanilreddy.blogspot.in/2012/02/high-level-business-scenarios-for.html )for identified workload models.
Step5: Execution the performance testing scenarios (See the execution process in following link http://madhuanilreddy.blogspot.in/2012/02/performance-testing-approach.html)
Step 6: Send the results to the manager and lead
Step 6: Send the results to the manager and lead
Difference between Correlation & parameterization?
No comparison between these two. Because correlation is capturing dynamic values from server and Parameterization is passing multiple values to the server.
See few differences
---------------------------------------------------------------------------------------------------------------
Correlation Parameterization
---------------------------------------------------------------------------------------------------------------
1.Finding the Dynamic values in server response 1. Passing multiple values to the server
and passing the value in the script
2.These values comes from server automatically 2. These values user need to took from data base manually
3. Tester doesn't know these values 3. Tester know these values.
4. Correlation is mandatory 4. This not mandatory but it is recommended
--------------------------------------------------------------------------------------------------------------
Wednesday, April 4, 2012
What is Correlation?
Performance testing is iteration process means create script for one real user and run the script for huge or many users. How server identifies the each user actions for multiple users, for this server creates an UNIQUE USER SESSION for every user. Using this session user can perform this actions or transactions. Once user signout from application , once again server creates new session for the same user. So for each user has unique sessions.
We created a script for real one user, so script records the unique session id in the script. If i am running second time script uses the recorded session id due to this script will throw error. So we need to change the dynamic values (like session Id) each user, this is called correlation. In computer science terminology making "constant" value to "variable".
Correlation is capturing the dynamic values from the server then passing that value to the script.
Tuesday, April 3, 2012
URL and PORT parametrize using JMeter
Scripts should be reusable means if client want to execute the script in QA environment then scripts should be run in QA environment and client want to run in SIT environment then scripts shold be run in SIT environment. For this performance tester is able to parametrize the Application URL and Port numbers.
If QA environment URL : http://staging.qa.com then just change the URL in parametrize file
If QA environment URL : http://staging.sit.com then just change the URL in parametrize file
So our script is reusable in any environment by doing parametrize.
For this we are using pre processor (User Parameter)
Step 1: Start Jmeter from jmeter.bat , In Jmeter UI should open then Add Thread group to "Test Plan"
Test Plan--> Thread Group

Step 2: Add HTTP Request to Thread Group
Thread Group--> Sampler--> Http Request

Here URL : www.google.com
Port: 80
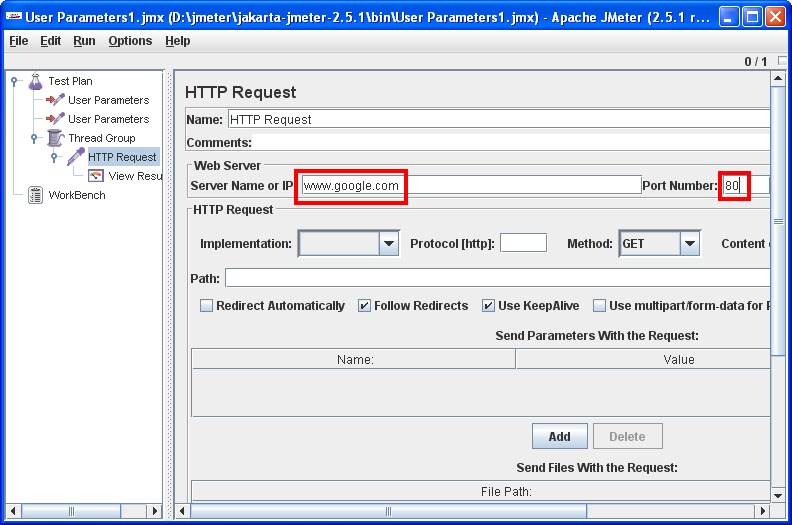
Then Start Parameterizing URL and PORT, see how to parameterize below
Step 4:Add user parameter to the test plan
Test Plan-->Pre processors--> User Parameters
Add two variables 'url' and 'port' to user parameters pre processor, shown below
Note: Add this just above to "Thread Group"


What is parametrization? Why Parameterization required?
Parameterizing is direct impact on performance test results, if performance tester not parameterize the script then response times should vary. Many of the performance tester are not doing parameterize during performance testing this is not at all recommended. Because performance testing should be realistic, so performance tester need to thing as end user of the application. Then application goes well in production.
What is parametrization?
Parameterization: Passing multiple values to the server is called Parameterization.
Why Parameterization required?
1.Through the use of different parameter values, you can avoid database caching. Means
If we send same user name & password multiple times to a website , Data base server keep the details in Buffer and fetch the information from the buffer due to this response times are not realistic. Beacuse in real world scenario each user logins with unique user credentials, so data should be fetch from DB data files(hard disk) not from buffers.
In Oracle most recent data kept in Buffer, so if user login and performed some activities, oracle kees the information in Buffer(DB block buffer), if i loged in scecond time data should get from buffer.
2.Your application might not allow a user to be logged on more than once simultaneously.
3. For mitigating realist scenario means in real word users are login with different ids but in our script we are login with same Id for different users. this is not real world scenario for this using Parameterization concept we are mitigating real word scenarios
Monday, April 2, 2012
JMeter Parameterization/Parameterizing
JMeter Parameterization:
When you want to run/execute one test plan for more than one user at the same time you go for parameterization. It is a method of generalizing an action.
We can do parametrization in two ways
Method-1:
Step1:- Record a webpage(Sample/Request) having login Scenario.
Example:-www.lowcostloadtest.com
Step2:-.Now we need a CSV data file from which we will import the values that are to be parametrized.Open notepad and enter Username and Password separated by commas.
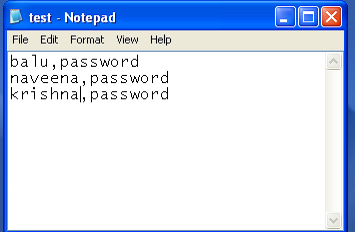
Save the file as “test.csv”.(inside bin folder)
Step3.:-Add->ConfigElement->CSV DataSet Config.Fill the fields as follows
Filename: test.csv (give entire path, if test.csv file is not in JMeter bin folder)
Variable names: A, B
Delimiter: ,
Recycle: true
Stop: false

Note : If test.csv file is out side the JMeter bin , please provide the entire path in FileName filed of the above screenshot. If test.csv file is in JMeter bin directory no need to provide entire path.
Note:-You can give the variable names as you wish.(like A,B).The variable names are reference inside the sample.
Step4:- Open the login sample(request).Goto ‘Send parameter with the request’ section
Note:-You can give the variable names as you wish.(like A,B).The variable names are reference inside the sample.
Step4:- Open the login sample(request).Goto ‘Send parameter with the request’ section
Now change the value of login field to : ${A}
and value of Password field to : ${B}
Here A and B are the variable names set in CSV Data Set config.

Step5:-.make sure to set number of threads(users) accordingly.

Step6:-.Run the script and observe the result in result tree.
Method-2: Using preprocessor (User Parameter)
Step1:Open a notepad and enter userid and password for three users.
Note:Save the file as test.csv. The extension csv makes it a comma separated Value (CSV) file should place in bin directory of the Jmeter

Step2: Select the Login sample and add a “User Parameter” from Thread Group->Pre Processors to it.

In parameters add three variables 'by clicking on 'Add Variable' and fill it as shown in below figure:

__CSVRead is a function which reads values from file test.csv . The second parameter of the function is the column number .Name is the variable name which is referenced in the request sample.

Step 3:select the login sample and change the values of userid and password to ${A} and ${B}.
 Now run the script and observe the result in view result tree
Method-2: Using preprocessor (User Parameter)
Step1:Open a notepad and enter userid and password for three users.
Note:Save the file as test.csv. The extension csv makes it a comma separated Value (CSV) file should place in bin directory of the Jmeter


In parameters add three variables 'by clicking on 'Add Variable' and fill it as shown in below figure:

__CSVRead is a function which reads values from file test.csv . The second parameter of the function is the column number .Name is the variable name which is referenced in the request sample.


JMeter correlation
Step1:-Add thread group to the testPlan.
Name :- irctc_correlation
Number of threads:- 1
Loop Count:- 1
Step2:-Change the LAN settings in internet browser.
Tools-->Internet Options-->Connections-->Click on LAN settings-->
Select Proxy server check box.
Address:-Local host
Port:-8090
Step3:-Add Http Proxy Server to the Workbench.
Port:-8090
select “Attempt HTTPS Spoofing” check box.
Target Controller:-TestPlan-->irctc_correlation
Click on Start button
Step4:-Enter the url address “http://www.irctc.co.in” in address bar.
Record the script as follow
Login-->Logout
Step5:-Click on stop button in Http Proxy Server.
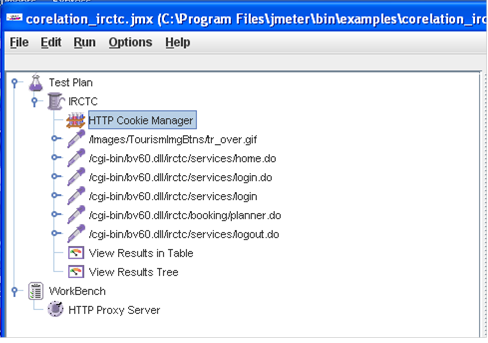
Step6:-Add Http Cookie Manager to the thread group.
Add View Results in Table to the Thread group.
Add View Results Tree to the Thread group.
Step7:-When you run the script it will show session expired in the listener. (View result tree->response data in Html rendered).The result may appear in red as failure.
So we should correlate the script with HTTP URL Rewriting Modifier.
Step8:-we observe the following BV_SessionID and BV_EngineID in http requests.

Step9:-Add two HTTP URL Re writing Modifiers to http requests which contains both BV_SessionID and BV_EngineID
i)Session Argument Name:BV_SessionID

ii)Session Argument Name:BV_EngineID

Note:-Don't forget to select “cache Session id?”
step9:Now change the variable values to “ * “ in the http requests.


Step10:-Save and Run the Script.Now the Result will be Successful.


Commands for System information finding
Using below commands easy to find the system information like
Server Release info
Server type
Memory
CPU
Operating System
Disk Drives....etc.


Server Release info
Server type
Memory
CPU
Operating System
Disk Drives....etc.
Unix/Linux monitoring commands?
System Information : Displaying system information like CPU,Memory... etc.
Memory and Swap:
Disks:
File systems and Devices:
Networking:
Crash Dump
Kernel Modules and Parameters:
Memory and Swap:
Disks:
File systems and Devices:
Networking:
Crash Dump
Kernel Modules and Parameters:
Sunday, April 1, 2012
What is Interrupt cycle?
CPU/OS is processing process p1, in process p1 there is an instruction
'read opd.txt file'. then CPU/OS gives this request to Device controller
(disk controller) then disk controller is reading the data from disk
mean while CPU should not Idle, CPU context switching to process p2
and process p1 is preempted .
1.CPU gives the request to Disk controller
2. Disk controller reads the data from disk to buffer, once reading is finished CPU raises an interrupt to OS/CPU , at that time may be P2 my running. CPU is executing the 5 instruction of the P2.
3.CPU send an IACK(Interrupt Acknowledge) to the Disk contoller. CPU will wait until completion of executing the 5 instruction of the P2. During this time no IACK should send to disk controller.
4.After receiving IACK, Device Controller sends an Interrupt Vector(set of bytes used an index for an ISR) to OS.
Every OS main the Vector Table , Vector table has Index and ISR in each row.
|-------------------------------------------|
| Index | ISR |
|------------------------------------------ |
| 222 | PrinterISR |
| 232 | DiskISR |
| 342 | Netw.orkISR |
-------------------------------------------
Above one is basic view of vector Table.
ISR: Interrupt service routine is Pointer to sub routine or functions. OS is bunch of C code partially assembly language(10%).OS code is million of lines.In this millions lines handling 'Disk Activity' is a small portion, so ISR points the specific code block/function/lines for executing those lines.
5. CPU before executing the ISR for disk controller (Ex: DiskISR), CPU do two things
i. Saves the next instruction (Instruction 6) of the P2 in STACK or saves the next PC (program counter)
in stack. Here saves only address of instruction 6 only because PC contain address of next instruction.
ii.Disable the Interrupts from same disk controller
6.Executes the Disk ISR means takes the data from Disk controller buffer and place that in Physical
memory.
Note: ISR not allowed recursion
Saturday, March 31, 2012
Companies that are using JMeter?
- ads-COM
- Alaloop
- AOL
- Applabs Technologies Pvt.Ltd
- ARDAS group
- ARIS B.V.
- AtlantBH
- AtlantBH
- Cofman
- Consology (Pty) Ltd
- South Africa
- Corporate Express Australia Ltd.
- CSIRO
- DATACOM
- DataResolve Systems
- eBuilder Technology Centre
- eFusion
- Ephibian
- DiSiD Technologies
- Innopath Software
- Innominds
- kippdata informationstechnologie GmbH
- Lufthansa Systems Indonesia
- Neev Information Technologies
- orbitz
- Panter
- Pragmatic Test Labs
- PrepMe
- SharpMind
- Sourcepole
- Talis
- Teamwork Technology
- France
- WatchMouse
- Sapient
- xrow GmbH
- Infospectrum India Pvt. Ltd
- Merit Software and Services Pvt. Ltd
- Hexaware Technologies
How to start JMeter?
Step1: Download the latest production release of JMeter
Download Link:
http://jakarta.apache.org/site/downloads/index.html
Or
\\Server\Location
Pre-requisites:
JMeter requires your computing environment meets some minimum requirements.
• JVM 1.4 or higher.
• Java path is set (e.g. C:\Program Files\Java\jdk1.5.0_06\bin)
Step2: Installation of JMeter
• Simply unzip the zip file into the directory where you want JMeter to be installed.
(C:\JmeterHome)
Step3: Running JMeter and building a Test Plan
• Click on jmeter.bat (for Windows) file in .\bin directory
• Then JMeter GUI should appear (Note: First time it can take few seconds to load)
What is Jmeter?What can I do with it?
The Apache JMeter desktop application is open source software, a 100% pure Java application designed to load test functional behavior and measure performance. It was originally designed for testing Web Applications but has since expanded to other test functions.
What can I do with it?
Apache JMeter may be used to test performance both on static and dynamic resources (files, Servlets, Perl scripts, Java Objects, Data Bases and Queries, FTP Servers and more). It can be used to simulate a heavy load on a server, network or object to test its strength or to analyze overall performance under different load types. You can use it to make a graphical analysis of performance or to test your server/script/object behavior under heavy concurrent load.
What is buffer and why buffers required?
CPU is processing process p1, in process p1 there is an instruction
'read opd.txt file'. then CPU gives this request to Device controller
(disk controller) then disk controller is reading the data from disk
and read data should placed in local 'Buffer' of the disk controller.
If some thing need to write then Data should be available in 'buffer' of the disk controller from that disk is reading. because CPU writes the data in massive rate but disk is very slow , so it is not possible to write the data in to disk due the speed. So CPU place the data into disk local buffers from that disk is reading.
If some thing need to write then Data should be available in 'buffer' of the disk controller from that disk is reading. because CPU writes the data in massive rate but disk is very slow , so it is not possible to write the data in to disk due the speed. So CPU place the data into disk local buffers from that disk is reading.
What is an IO?
IO is Input (reading data) or Output (writing data).
IO always between Disk and Disk controller. But not memory and Disk.
CPU is processing process p1, in process p1 there is an instruction 'read opd.txt file'. then CPU gives this request to Device controller (disk controller) then disk controller is reading the data from disk and read data should placed in local 'Buffer' of the disk controller.
If some thing need to write then Data should be available in 'buffer' of the disk controller from that disk is reading. because CPU writes the data in massive rate but disk is very slow , so it is not possible to write the data in to disk due the speed. So CPU place the data into disk local buffers from that disk is reading.
What is an interrupt
IO is always between device and device controller. CPU reads/write the data in Giga Hedge speed but disk are very slow , due to this disk looses some data during reading the data from CPU. So Disk controller has local buffers for solving this issue. First CPU place the data in to Disk buffers from that Disk reads. same thing for write also.
CPU is processing process p1, in process p1 there is an instruction 'read opd.txt file'. then CPU gives this request to Device controller (disk controller) then disk controller is reading the data from disk mean wile CPU should not Idle, CPU context switching to process p2 and process p1 is preempted . Once disk is finished reading the data from disk (and placed this data into disk controller), disk controller raises an interrupt to CPU "saying that ready is finished" at time P2 or P3 or P4 may running in CPU, then ISR executes and data is read from disk controller to memory.
This is called Hardware interrupt.
What is preemption or context switching
Device controller and CPU can work concurrently. All Devices like Hard disk, magnetic disks, Printers, Memory are dumb, means they won't work with out device controller.
If i want to read some file from Disk , Disk controller reads the data from disk to Disk controller buffer then it transfer to main memory. Then user is able to read the file.
CPU is processing process p1, in process p1 there is an instruction 'read opd.txt file'. then CPU gives this request to Device controller (disk controller) then disk controller is reading the data from disk mean wile CPU should not Idle and CPU context switching to process p2 and process p1 is preempted . This is Called Context switching.
Thursday, March 29, 2012
Entry citeria and Exit criteria for Performance testing?
Entry Criteria:
1.Functionally application should stable.
2.All functional testing should be passed..
Note: Before going to start performance testing above two conditions should passed.
Exit criteria:
1. Application should meet performance goals or SLA.
Uses of Doing Performance testing
IRCTC is an application of Rail way Dep (organization) and Central govt is the client. If we want to build an application, organization required
--Developers
-- Administrators( DB and Application server administrator).
--Network administrators and
--Architects majorly.
Finally end users(me,you ...etc) are using the applications. Here client( is earning the money because of using the application (IRCTC).
If
application is opening after 20 min , no end user will use the
application.This problem will solved by doing Performance testing before
releasing the application to the product.This is main use of doing
performance testing.
Other reasons are:
1. Finding development issues like
a. Memory leaks
b. Synchronization points
c. Slow queries ....etc.
2.Administrator issues like
a. High CPU Utilization
b. High Memory Utilization
c. Connection pool issues
d. Socket issues and ...etc.
3. Architecture issues like
a. Poor db design
b.Poor software identifications .. etc.
Wednesday, March 28, 2012
Capacity Planning
Overview
Capacity planning is the process of planning for growth and forecasting peak usage periods in order to meet system and application capacity requirements. It involves extensive performance testing to establish the application's resource utilization and transaction throughput under load. First, you measure the number of visitors the site currently receives and how much demand each user places on the server, and then you calculate the computing resources (CPU, RAM, disk space, and network bandwidth) that are necessary to support current and future usage levels. This How To describes two methodologies for capacity planning:
1.Transaction cost analysis. Transaction cost analysis calculates the cost of the most important user
operations of an application in terms of a limiting resource. The resource can be CPU, memory, disk,
or network. You can then identify how many simultaneous users can be supported by your hardware
configuration or which resource needs to be upgraded to support an increasing number of users and
by how much.
2. Predictive analysis. Predictive analysis forecasts the future resource utilization of your application
based on past performance. To perform predictive analysis, you must have historical data available
for analysis.
Note: The sample application referred to in this How To is not an actual application, and the data used is not based on any actual test results. They are used only to illustrate the concepts in the discussion.
Transaction Cost Analysis
The process of using transaction cost analysis for capacity planning consists of the following steps:
1.Compile a user profile: Compiling a user profile means understanding your business volumes and usage
patterns. Generally, you obtain usage information by analyzing log files.
2.Execute discrete tests: Execute tests on specific user operations based on the profiles created in the
previous step.
3.Measure the cost of each operation:Using the performance data captured in the previous step, calculate
the cost of each user operation.
4.Calculate the cost of an average user profile: Calculate the cost of an average user profile by assuming
fixed period of activity for an average user (for example, 10
minutes).
5.Calculate site capacity: Based on the cost of each user profile, calculate the maximum number of users
supported by the site.
6.Verify site capacity:Verify site capacity by running a script that reflects the user profile with an
increasing number of users and then comparing the results against those obtained
in previous steps.
The next sections describe each of these steps.
Step 1: Compile a User Profile
Compile a user profile from the existing production traffic data. The main resource for identifying user operations is the Internet Information Services (IIS) log files. The components extracted from usage profiles are as follows:
• A list of user profiles.
• The average duration of a user session.
• The total number of operations performed during the session.
• The frequency with which users perform each operation during the session.
To compile a user profile
1. Identify the number of user requests for each page and the respective percentages.
The number of user requests for each page can be extracted from the log files. Divide the number of requests for each page by the total number of requests to get the percentage.
Table 1: illustrates a sample profile.
Table 1: User Requests per Page
---------------------------------------------------------------------
ID URI Number of requests Percentages
---------------------------------------------------------------------
1 /MyApp/login.aspx 18,234 35%
2 /MyApp/home.aspx 10,756 20%
3 /MyApp/logout.aspx 9,993 19%
4 /MyApp/SellStock.aspx 4,200 8%
5 /MyApp/BuyStock.aspx 9,423 18%
----------------------------------------------------------------------
Total 52,606 100%
----------------------------------------------------------------------
2. Identify the logical operations and number of requests required to complete the operation.
A user operation can be thought of as a single complete logical operation that can consist of more than one request. For example, the login operation might require three pages and two requests. The total number of operations performed in a given time frame can be calculated by using the following formula:
Number of operations = Number of requests / Number of requests per operation
The Requests per operation column in Table 2 shows how many times the page was requested for a single operation.
Table 2: User Requests per Operation
-------------------------------------------------------------------------------------------------------
ID URI Number of requests Requests per operation Number of operations
-------------------------------------------------------------------------------------------------------
1 /MyApp/login.aspx 18,234 2 9,117
2 /MyApp/logout.aspx 9,993 1 9,993
3 /MyApp/SellStock.aspx 4,200 2 2,100
4 /MyApp/BuyStock.aspx 9,423 3 3,141
------------------------------------------------------------------------------------------------------
Total n/a 41,850 8 24,351
------------------------------------------------------------------------------------------------------
3.Identify the average user profile, session length, and operations per session. You can analyze the IIS log files to calculate the average user session length and the number of operations an average user performs during the session. The session length for the sample application was calculated as 10 minutes from the IIS logs, and the average user profile for the sample application is shown in Table 3.
Table 3: Average User Profile
----------------------------------------------------------------------------------
Operation Number of operations executed
during an average session
-----------------------------------------------------------------------------------
Login 1
SellStock 3
BuyStock 2
Logout 1
---------------------------------------------------------------------------------
For more information about identifying user profiles, see "Workload Modeling" in Chapter 16, "Testing .NET Application Performance."
Step 2: Execute Discrete Tests
Run discrete tests for each user operation identified in Step 1 for a load at which your system reaches maximum throughput. For example, you need to run separate tests for Login, BuyStock, and SellStock operations. The test script only fires the requests for a dedicated user operation.
The procedure for executing the tests consists of the following tasks:
•Set up the environment with the minimum number of servers possible. Make sure that the architecture of
your test setup mirrors your production environment as closely as possible.
•Create a test script that loads only the operation in consideration without firing any redundant requests.
•Define the point at which your system reaches maximum throughput for the user profile. You can identify
this point by monitoring the ASP.NET Applications\ Requests/Sec counter for an ASP.NET application
when increasing the load on the system. Identify the point at which Requests/Sec reaches a maximum
value.
•Identify the limiting resource against which the cost needs to be calculated for a given operation. List the
performance counters you need to monitor to identify the costs. For example, if you need to identify the
cost of CPU as a resource for any operation, you need to monitor the counters listed in Table 4.
----------------------------------------------------------------------------
Object Counter Instance
---------------------------------------------------------------------------
Processor % Processor Time _Total
ASP.NET Applications Requests/Sec Your virtual directory
-----------------------------------------------------------------------------
Note Requests/Sec will be used to calculate the processor cost per request.
•Run load tests for a duration that stabilizes the throughput of the application. The duration can be
somewhere between 15 to 30 minutes. Stabilizing the throughput helps create a valid, equal
distribution of the resources over a range of requests.
Output
The output from executing this series of steps for each scenario would be a report like the following:
Number of CPUs = 2
CPU speed = 1.3 GHz
Table 5 shows a sample report for the results of the load tests.
Table 5: Load Test Results
----------------------------------------------------------------------------------------------------
User operation Process\% Processor Time ASP.NET Applications\Requests/Sec
----------------------------------------------------------------------------------------------------
Login 90% 441
SellStock 78% 241
BuyStock 83% 329
Logout 87% 510
---------------------------------------------------------------------------------------------------
Step 3: Measure the Cost of Each Operation
Measure the cost of each operation in terms of the limiting resource identified in Step 2. Measuring the operation cost involves calculating the cost per request and then calculating the cost per operation. Use the following formulas for these tasks:
•Cost per request: You can calculate the cost in terms of processor cycles required for processing a request by using the following formula:
Cost (Mcycles/request) = ((number of processors x processor speed) x processor use) / number of requests per second
For example, using the values identified for the performance counters in Step 2, where processor speed is 1.3 GHz or 1300 Mcycles/sec, processor usage is 90 percent, and Requests/Sec is 441, you can calculate the page cost as:
((2 x 1,300 Mcycles/sec) x 0.90) / (441 Requests/Sec) = 5.30 Mcycles/request
•Cost per operation: You can calculate the cost for each operation by using the following formula:
Cost per operation = (number of Mcycles/request) x number of pages for an operation
The cost of the Login operation is:
5.30 x 3 = 15.9 Mcycles
If you cannot separate out independent functions in your application and need one independent function as a prerequisite to another, you should try to run the common function individually and then subtract the cost from all of the dependent functions. For example, to perform the BuyStock operation, you need to perform the login operation, calculate the cost of login separately, and then subtract the cost of login from the cost of the BuyStock operation.
Therefore the cost of a single BuyStock operation can be calculated as follows:
Single cost of BuyStock operation = Total cost of BuyStock – Cost of Login operation
The cost of a single BuyStock operation is:
39.36 – 15.92 = 23.44 Mcycles
Table 6 shows the cost of each user operation in a sample application using the following scenario.
CPU Speed = 1300 MHz
Number of CPUs = 2
Overall CPU Mcycles = 2,600
Table 6: Cost per Operation for Login, SellStock, BuyStock, and Logout Operations
----------------------------------------------------------------------------------------------------------------------------------
User CPU % Total net ASP.NET Number Operation #pages cost of
Operation Utilization CPU Mcycles Requests/Sec of Requests Cost(Mcycles) without single operation
login
-----------------------------------------------------------------------------------------------------------
Login 90% 2,340.00 441 3 15.92 3 15.92
SellStock 78% 2,028.00 241 5 42.07 2 26.16
BuyStock 83% 2,158.00 329 6 39.36 3 23.44
Logout 87% 2,262.00 510 5 22.18 2 6.26
----------------------------------------------------------------------------------------------------------------------------------
The operation cost needs to be measured separately for each tier of an application.
Step 4: Calculate the Cost of an Average User Profile
The behavior of actual users can cause random crests and troughs in resource utilization. However, over time these variations even out statistically to average behavior. The user profile you compiled in Step 1 reflects average user behavior. To estimate capacity, you need to assume an average user and then calculate the cost in terms of the limiting resource identified in Step 2.
As shown in Table 7, during a ten-minute session, an average user needs 147.52 Mcycles of CPU on the server. The cost per second can be calculated as follows:
Average cost of profile in Mcycles/sec = Total cost for a profile / session length in seconds
Thus, the average cost for the profile shown in Table 7 is:
147.52/600 = 0.245 Mcycles/sec
This value can help you calculate the maximum number of simultaneous users your site can support.
Table 7: Cost of an Average User Profile
-----------------------------------------------------------------------------------------------------------------------------
Average User Profile Number of operations Cost per operation Total cost per operation
executed during an (Mcycles) (Mcycles)
average session
--------------------------------------------------------------------------------------------------------
Login 1 15.92 15.92
SellStock 3 26.16 78.47
BuyStock 2 23.44 46.87
Logout 1 6.26 6.26
--------------------------------------------------------------------------------------------------
Total 147.52
---------------------------------------------------------------------------------------------------------
Step 5: Calculate Site Capacity
Calculating site capacity involves knowing how many users your application can support on specific hardware and what your site's future resource requirements are. To calculate these values, use the following formulas:
•Simultaneous users with a given profile that your application can currently support. After you determine the cost of the average user profile, you can calculate how many simultaneous users with a given profile your application can support given a certain CPU configuration. The formula is as follows:
Maximum number of simultaneous users with a given profile = (number of CPUs) x (CPU speed in Mcycles/sec) x (maximum CPU utilization) / (cost of user profile in Mcycles/sec)
Therefore, the maximum number of simultaneous users with a given profile that the sample application can support is:
(2 x 1300 x 0.75)/0.245 = 7,959 users
•Future resource estimates for your site. Calculate the scalability requirements for the finite resources that need to be scaled up as the number of users visiting the site increases. Prepare a chart that gives you the resource estimates as the number of users increases.
Based on the formulas used earlier, you can calculate the number of CPUs required for a given number of users as follows:
Number of CPUs = (Number of users) x (Total cost of user profile in Mcycles/sec) / (CPU speed in MHz) x (Maximum CPU utilization)
If you want to plan for 10,000 users for the sample application and have a threshold limit of 75 percent defined for the processor, the number of CPUs required is:
10000 x 0.245 / (1.3 x 1000) x 0.75 = 2.51 processors
Your resource estimates should also factor in the impact of possible code changes or functionality additions in future versions of the application. These versions may require more resources than estimated for the current version.
Step 6: Verify Site Capacity
Run the load tests to verify that the transaction cost analysis model accurately predicts your application capacity and future requirements.
Verify the calculated application capacity by running load tests with the same characteristics you used to calculate transaction cost analysis. The verification script is simply a collection of all transaction cost analysis measurement scripts, aggregated and run as a single script.
The actual values and the estimated values should vary by an acceptable margin of error. The acceptable margin of error may vary depending on the size of the setup and the budget constraints. You do not need to run load tests each time you perform transaction cost analysis. However, the first few iterations should confirm that transaction cost analysis is the correct approach for estimating the capacity of your application.
Predictive Analysis
Predictive analysis involves the following steps:
1.Collect performance data:Collect performance data for the application in production over a period of
time.
2.Query the existing historical data:Query the historical data based on what you are trying to analyze or
predict.
3.Analyze the historical performance data:Use mathematical equations to analyze the data to
understand the resource utilization over a period of time.
4.Predict the future requirements:Predict the future resource requirements based on the mathematical
model prepared in Step 2.
The next sections describe each of these steps.
Step 1: Collect Performance Data
The performance data for the application needs to be collected over a period of time. The greater the time duration, the greater the accuracy with which you can predict a usage pattern and future resource requirements.
The performance counters and other performance data to be collected are based on your performance objectives related to throughput, latency, and resource utilization. The performance counters are collected to verify that you are able to meet your performance objectives and your service level agreements. For information about which counters to look at, see Chapter 15, "Measuring .NET Application Performance."
Be careful not to collect more than the required amount of data. Monitoring any application incurs overhead that may not be desirable beyond certain levels for a live application.
You might further instrument the code to analyze custom performance metrics. One of the tools available for storing and analyzing this performance data in large quantities is Microsoft Operations Manager (MOM).
Step 2: Query the Existing Historical Data
Query the historical data based on what you are trying to analyze. If your application is CPU bound, you might want to analyze CPU utilization over a period of time. For example, you can query the data for the percentage of CPU utilization for the last 40 days during peak hours (9:00 A.M.–4:00 P.M.), along with the number of connections established during the same period.
Step 3: Analyze the Historical Performance Data
Before you analyze the historical performance data, you must be clear about what you are trying to predict. For example, you may be trying to answer the question, "What is the trend of CPU utilization during peak hours?"
Analyze the data obtained by querying the database. The data obtained for a given time frame results in a pattern that can be defined by a trend line. The pattern can be as simple as a linear growth of the resource utilization over a period of time. This growth can be represented by an equation for a straight line:
y = mx + b
where b is the x offset, m is the slope of the line, and x is an input. For the preceding question, you would solve for x given y:
x = (y – b)/m
For the example in Step 1, the trend line is:
y = 0.36x + 53
where y is the CPU utilization and x is the number of observations. Figure 1 shows the trend for this example.
 |
| Figure 1: Trend of CPU utilization |

Choosing the correct trend line is critical and depends on the nature of the source data. Some common behaviors can be described by polynomial, exponential, or logarithmic trend lines. You can use Microsoft Excel or other tools for trend line functions for analysis.
Step 4: Predict Future Requirements
Using the trend lines, you can predict the future requirements. The predicted resource requirements assume that the current trend would continue into the future.
For example, consider the trend line mentioned in Step 3. Assuming you do not want the CPU utilization to increase beyond 75 percent on any of the servers, you would solve for x as follows:
x = (y – 53)/0.36
Therefore:
x = (75 – 53)/0.36 = 61.11
Based on the current trends, your system reaches 75 percent maximum CPU utilization when x = 61.11. Because the x axis shows daily measurements taken from the peak usage hours of 9:00 A.M. to 4:00 P.M., one observation corresponds to one day. Because there are 40 observations in this example, your system will reach 75 percent CPU utilization in the following number of days:
61.11 – 40 = 21.11
Subscribe to:
Posts (Atom)