Thursday, February 23, 2012

How web browser communicates with web server?


Here are the steps:
(a) The browser extracts the server's hostname from the URL.
(b) The browser converts the server's hostname into the server's IP address.
(c) The browser extracts the port number (if any) from the URL.
(d) The browser establishes a TCP connection with the web server.
(e) The browser sends an HTTP request message to the server.
(f) The server sends an HTTP response back to the browser.
(g) The connection is closed, and the browser displays the document.
Below is the Example:


What is web server? What is the Use of Web server?


Web server is a server, it handles HTTP protocol. When web server receive the http request (Ex http://gmail.com), it respond with an http response, such as sending back an HTML page.

In detail below is the example for http request and Http response
Uses of Web server:
1. Reduce the traffic to App server (all static data can handled by Web server only business logic should go Application server)
2. Most secure because it captures the end user system information like
a. IP address,
b. Browser information (which browser),
c. what request user sent
d. which OS end user using and
            e. Date and Time

Examples for web server:

Wednesday, February 22, 2012

Performance Test Plan table of content.

3 IN Scope. 4
  At a high level, the following are in the scope of the ACD5 performance testing:- 
   
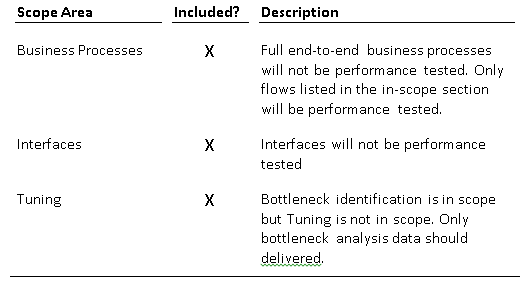
4 Out of Scope. 5
At a high level, the following are out of scope of the ACD5 performance testing:- 

What is performance testing scenario ? What it contains.


Scenario: A scenario describes the events that occur during a testing session. A
scenario includes a list of machines on which Vusers run, a list of scripts that
the Vusers run, and a specified number of Vusers or Vuser groups that run
during the scenario.

We creates the scenario depending on NFR document/SLA. In NFR/SLA contains the what are all performance testing type need to do.

Below are the high-level business scenarios:
Scenario 1: Performing light load testing on the following scenarios with the load distribution shown below.
Script 1: With 33 % load
Script 2: With 67% load


Scenario2: Performing Load testing on the below scenarios with 100 users, with the load distribution shown below.
Script i: with 33 % load of 100 Virtual users
Script ii: With 55% load of 100 Virtual users
Script iii: With 12% load of 100 Virtual users with the below scenario settings
Ramp up: Every 2 for 4 sec
Ramp down: Stop every 5 users for 10 sec
Duration: 2 hours
Think time: 14 sec
Pacing: 9 sec
With the following ramp-up and ramp-downs:
a. Ramp up and stay at max users for few hours (Fig - 2)
b. Single hump, ramp up, stay at max users for few hours, and then ramp down (Fig ‑ 3)
c. Multiple humps during ramp up / ramp down (slowly ) (Fig - 4)
d. Spikes, multiple ramp up / down within short interval of time (Fig - 5)


Scenario 3: Performing the Peak Load test on the below scenarios between 8 AM to 11 AM and 12:30 PM to 4 PM with 100 users, with the load distribution shown below.
Script i: with 33 % load of 100 Virtual users
Script ii: With 55% load of 100 Virtual users
Script iii: With 12% load of 100 Virtual users with the below scenario settings
Scenario 4: Perform the longevity test for Scenarios 1 and 2 for longer duration with the following settings.
Ramp up: Every 2 for 4 sec
Ramp down: Stop every 5 users for 10 sec
Duration: 18 hours
Think time: 14 sec
Pacing: 9 sec
Scenario 5: Perform the load test for Scenarios 1 and 2 with rendezvous point (concurrent users) with 10 users.
Ramp up: Every 2 for 4 sec
Ramp down: Stop every 5 users for 10 sec
Duration: 1 hour
Think time: 14 sec
Pacing: 9 sec
Scenario 6: Perform the Stress test for Scenarios 1 and 2 beyond the SLA for Scripts I and II.
Ramp up: Every 3 for 7 sec
Ramp down: Stop every 5 users for 10 sec
Duration: 2hour
Think time: 14 sec
Pacing: 9 sec
Scenario 7: Performing the spike test on the below scenarios with 100 users, with the load distribution shown below.
Script i: with 33 % load of 100 Virtual users
Script ii: With 55% load of 100 Virtual users
Script iii: With 12% load of 100 Virtual users with the below scenario settings

Performance testing Execution approach

Performance testing approach:
Before deployment to production, at least three cycles of load tests followed by a stress test and endurance test (at least for 12 hours) will be planned. Baseline and benchmark testing will be performed before load, stress, and endurance testing.
Approach
Steps 1 – Baseline Test: For the application, irrespective of time availability, performance testing will start with baseline testing. Baseline testing is nothing but one user test, which will help to identify the correctness of the test scripts and check whether the application meets the SLAs (Service Level Agreements) for a one-user load. These values can be used a benchmark for newer versions to compare performance improvements.
Step 2 – Benchmark Test: Next is the benchmark test for at least 15–20% of the target load. Benchmark testing helps to identify the correctness of the test scripts and tests the readiness of the system before running target load tests.
Step 3 – Load Test: Always plan to run at least three rounds of load test. Despite doing a slow ramp-up, it’s advisable to have three individual load tests for 50%, 75%, and 100% of the target load. (The load level should be defined based on system performance rather than just 50%, 75%, and 100% target load levels.)
Test Scenario – Have a slow ramp-up, followed by a stable period for at least an hour, and then ramp down. During the stable period, the target user load needs to perform various operations on the system with realistic think times. All the metrics measured should correspond only to the stable period and not the ramp-up/ramp-down period. Transaction response time should not be concluded based on only one or two iterations. The server should be monitored for a minimum of five iterations at the same load level before concluding the response time metrics because there could be some reason for higher/lower response time at any given time. That is why it is advisable to watch server performance for at least five iterations at the same load level (during stable load period) and use the 90th percentile response time to report the response time metrics.
Step 4 – Stress Test: Load tests should be always followed by stress tests. Based on the load test results, slowly increase the server load step by step to determine the server break point. For this test, realistic think time settings and cache settings are not required, as the objective is to know the server break point and how it fails.
Step 5 – Endurance Test: Endurance (stability) tests need to be run at least for 10–12 hours to identify the memory bottlenecks. They need not be run for peak load but it can be run for average load levels.

Jprofiler Configuring for Jboss application server and Jboss portal server

Jprofiler Configuration for Jboss Application server
For profiling your application you required two Jprofiler softwares
1. Is for Agent (Agent sit in Application server for collecting the profiling counters which may be any Linux/Unix machines)
2. Is for Monitoring collecting data (which is having GUI and sits on any Windows machine)
Note: It is possible to monitor your application from one Jprofiler but we require
a. GUI for that Linux machine (Now day mostly all Unix/Linux are in CLI interface, so we just installing agent in Unix/Linux machines and monitoring from windows machine)
b. It is not recommended because Jprofiler uses Java flat form and your Application server require Java flat form then it is difficult to profile the application)
Agent Configuration:
Step 1: Open the following URL http://www.ej-technologies.com/download/jprofiler/files.html and download the suitable Jprofiler and Place this in your Unix/Linux machine (assume you placed this in /opt)
Or
Open the following URL http://www.ej-technologies.com/download/jprofiler/files.html and right click on suitable Jprofiler and select the “Copy link address”. Then open the server using putty (cd /opt) and enter the following command wget –c http://download.ej-technologies.com/jprofiler/jprofiler_linux_7_1.tar.gz (paste the copied link here)
Note: Use following commands in your putty session for finding suitable version
Cat /proc/*release
Step 2: If your file extension is tar.gz the do the following commands for extraction
gunzip filename
tar filename
Step 3: In Linux machine open .bash_profile file (usually located in /root directory)
Enter jprofiller location (using export command) in .bash_profile file
export JPROFILER_HOME =/opt/jprofiler6/bin/linux-x86
Step 4: Open run.conf from Jboss_Home/bin then add the below content in the run.conf file
JAVA_OPTS="$JAVA_OPTS -agentpath:/opt/jprofiler6/bin/linux-x86/libjprofilerti.so=port=8849 -Xbootclasspath/a:/opt/jprofiler6/bin/agent.jar"
Monitoring the Profiling Data from Windows machine :
Step 1: Install the Jprofiler in windows machine (agent version and this version should be same)
Step 2: From ‘Quick Start‘ Screen select “An application on a remote computer” option and click on next button
Step 3: From the Wizard select “On remote computer” and select which OS your app server /agent is running and click on next
Step 4: From JVM Vendor , version . Select which vendor JVM using , version and click on next
Step 5: Select “wait for a connection From the Jprofiler GUI”
Step 6: Start your jboss now from your putty
Preconditions:
1. JRE required
2. Jboss server need to Stop before configuring the agent
3. License key required in Windows environment (Agent does not required license key)

Tuesday, February 21, 2012

Jpofiler Configuration in Tomcat App server

Jprofiler Configuration for Jboss Application server
For profiling your application you required two Jprofiler softwares
1. Is for Agent (Agent sit in Application server for collecting the profiling counters which may be any Linux/Unix machines)
2. Is for Monitoring collecting data (which is having GUI and sits on any Windows machine)
Note: It is possible to monitor your application from one Jprofiler but we require
a. GUI for that Linux machine (Now day mostly all Unix/Linux are in CLI interface, so we just installing agent in Unix/Linux machines and monitoring from windows machine)
b. It is not recommended because Jprofiler uses Java flat form and your Application server require Java flat form then it is difficult to profile the application)
Agent Configuration:
Step 1: Open the following URL http://www.ej-technologies.com/download/jprofiler/files.html and download the suitable Jprofiler and Place this in your Unix/Linux machine (assume you placed this in /opt)
Or
Open the following URL http://www.ej-technologies.com/download/jprofiler/files.html and right click on suitable Jprofiler and select the “Copy link address”. Then open the server using putty (cd /opt) and enter the following command wget –c http://download.ej-technologies.com/jprofiler/jprofiler_linux_7_1.tar.gz (paste the copied link here)
Note: Use following commands in your putty session for finding suitable version
Cat /proc/*release
Step 2: If your file extension is tar.gz the do the following commands for extraction
gunzip filename
tar filename
Step 3: In Linux machine open .bash_profile file (usually located in /root directory)
Enter jprofiller location (using export command) in .bash_profile file
export JPROFILER_HOME =/opt/jprofiler6/bin/linux-x86
Step 4:Go Tomcat installation directory. Open catalena.sh file from bin folder
Enter the below details in catelana.sh file (only red color information and black color you can find by default in catalena.sh file)
export JPROFILER_HOME
JAVA_OPTS="-Xms768m -Xmx1024m -XX:PermSize=256m -XX:MaxPermSize=256m -Dfile.encoding=UTF8 -agentpath:/opt/Performance/jprofiler7/bin/linux-x86/libjprofilerti.so=port=8849"
Monitoring the Profiling Data from Windows machine :
Step 1: Install the Jprofiler in windows machine (agent version and this version should be same)
Step 2: From ‘Quick Start‘ Screen select “An application on a remote computer” option and click on next button
Step 3: From the Wizard select “On remote computer” and select which OS your app server /agent is running and click on next
Step 4: From JVM Vendor , version . Select which vendor JVM using , version and click on next
Step 5: Select “wait for a connection From the Jprofiler GUI”
Step 6: Start your jboss now from your putty
Preconditions:
1. JRE required
2. Jboss server need to Stop before configuring the agent
3. License key required in Windows environment (Agent does not required license key)