Wednesday, March 28, 2012


Tuesday, March 27, 2012
Questioners for performance testing requirement gathering
Check list for performance testing requirements gathering ?
Requirement gathering is very import for any project , for making this phase success . Ask the below Questions to your client or BA (Business analyst) or send a mail with the below questions. Please find the requirement gathering Questioners below
Requirement gathering is very import for any project , for making this phase success . Ask the below Questions to your client or BA (Business analyst) or send a mail with the below questions. Please find the requirement gathering Questioners below
Wednesday, March 21, 2012
Performance Testing Approach
Monday, March 19, 2012


Sunday, March 18, 2012
Too many files opened issue
How to solve too many files issue?
This issue occur in two areas
1. If Web server, App server and Data base servers residing in One machine, then you m ayget this error
2. If socket timed out not mentioned then this issue may this issue.
Using ulimit -a command, we will find how many sockets had that machine. In any machine 1024 is the maximum sockets.
Bottleneck identification:
Using netstat -a|grep WAIT|wc -l command we will find how many sockets opened by the application. If 1024 connection are utilized then we will get too many open files.
If you want know which server opened more socket, just use lsof -p <Process ID> for finding the sockets opened by that process.
Internal Process of a socket: All HTTP requests internally used TCP connection. One TCP connection is one Socket in computer science language. So if you send n number of requests to the server , the server opens the socket to handle your requests but we need to close the sockets once your request got over other wise socket won't close, for this we need to mention the socket timed out.
Solutions:
For issue 1: Just increase the sockets using ulimit -Hn <Parameter> (Ex ulimit -Hn 2048)command, but it is not recommended , you have to discuss with your architect on this.
For issue 2: Just provide the socket time out in your server configuration file. In web server change the value in uri_worker.property file
This issue occur in two areas
1. If Web server, App server and Data base servers residing in One machine, then you m ayget this error
2. If socket timed out not mentioned then this issue may this issue.
Using ulimit -a command, we will find how many sockets had that machine. In any machine 1024 is the maximum sockets.
Bottleneck identification:
Using netstat -a|grep WAIT|wc -l command we will find how many sockets opened by the application. If 1024 connection are utilized then we will get too many open files.
If you want know which server opened more socket, just use lsof -p <Process ID> for finding the sockets opened by that process.
Internal Process of a socket: All HTTP requests internally used TCP connection. One TCP connection is one Socket in computer science language. So if you send n number of requests to the server , the server opens the socket to handle your requests but we need to close the sockets once your request got over other wise socket won't close, for this we need to mention the socket timed out.
Solutions:
For issue 1: Just increase the sockets using ulimit -Hn <Parameter> (Ex ulimit -Hn 2048)command, but it is not recommended , you have to discuss with your architect on this.
For issue 2: Just provide the socket time out in your server configuration file. In web server change the value in uri_worker.property file
Where web server residing in any Application architecture?
Web server always residing before the Application server. The request flow from client to server shown below
Client-->Web server --->Application server ---->Data base Server.
1.Client sends the request to the server
2.web server takes the request from the client,if the request has business logic then using load balancing request will goes to the Application server
3.Request will goes to DB server using the connection pool configuration.
How HTTP request passes through OSI layers for communicating the web server?
In this way, HTTP is the top layer in a "protocol stack" of "HTTP over TCP over IP," as depicted in Figure shown below. A secure variant, HTTPS, inserts a cryptographic encryption layer (called TLS or SSL) between HTTP and TCP .
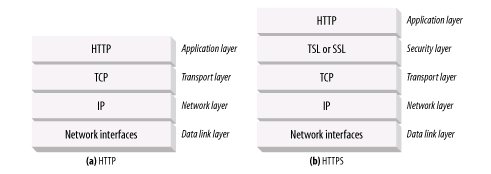
HTTP Request Vs ISO layers
When HTTP wants to transmit a message, it streams the contents of the message data, in order, through an open TCP connection. TCP takes the stream of data, chops up the data stream into chunks called segments, and transports the segments across the Internet inside envelopes called IP packets . This is all handled by the TCP/IP software; the HTTP programmer sees none of it.
Friday, March 16, 2012
Performance Testing and How to identify performance objectives?
Performance Testing:
Finding the application behavior with respective of
|--Response Time
|--Throughput
|--CPU Utilization ..... (Above 3 values may change depending upon the Client requirement).
Before going to start Performance testing, performance tester required NFR(Non function requirement)/SLA( Service Level Agreement)/Performance Objectives,why we required because with out knowing objective nothing to do.
Ex: My teacher told "Go That District", this is meaning less. So teacher need to tell " GO Hyderabd". Then it is very easy to do this. So we required objectives. what NFR/SLA document contains is Objectives.
Below are the Objectives for Performance Testing.
1. Number of users the application needs to support (Ex: 1000 users need to support)
2. Response time (Ex:less than 8 sec for all pages)
3.CPU Utilization (Ex: less than 80%)
4. Memory Utilization (Ex: less than 80%).
Note:
1. We can call all above 4 as SCOPE of application
2. Some time Functional test plan contains NFR details. Some times client/Manager will give separate NFR document.
3. NFR document contain performance related information and Security testing related ..... e.t.c.
IRCTC is an application of Rail way Dep (organization) and Central govt is the client. If we want to build an application, organization required
--Developers
-- Administrators( DB and Application server administrator).
--Network administrators and
--Architects majorly.
Finally end users(me,you ...etc) are using the applications. Here client( is earning the money because of using the application (IRCTC).
1. Finding development issues like
a. Memory leaks
b. Synchronization points
c. Slow queries ....etc.
2.Administrator issues like
a. High CPU Utilization
b. High Memory Utilization
c. Connection pool issues
d. Socket issues and ...etc.
3. Architecture issues like
a. Poor db design
b.Poor software identifications .. etc.
Functional testing should over and Build should stable for doing performance testing.
Finding the application behavior with respective of
|--Response Time
|--Throughput
|--CPU Utilization ..... (Above 3 values may change depending upon the Client requirement).
Before going to start Performance testing, performance tester required NFR(Non function requirement)/SLA( Service Level Agreement)/Performance Objectives,why we required because with out knowing objective nothing to do.
Ex: My teacher told "Go That District", this is meaning less. So teacher need to tell " GO Hyderabd". Then it is very easy to do this. So we required objectives. what NFR/SLA document contains is Objectives.
Below are the Objectives for Performance Testing.
1. Number of users the application needs to support (Ex: 1000 users need to support)
2. Response time (Ex:less than 8 sec for all pages)
3.CPU Utilization (Ex: less than 80%)
4. Memory Utilization (Ex: less than 80%).
Note:
1. We can call all above 4 as SCOPE of application
2. Some time Functional test plan contains NFR details. Some times client/Manager will give separate NFR document.
3. NFR document contain performance related information and Security testing related ..... e.t.c.
What is the Use of Doing Performance testing?
IRCTC is an application of Rail way Dep (organization) and Central govt is the client. If we want to build an application, organization required
--Developers
-- Administrators( DB and Application server administrator).
--Network administrators and
--Architects majorly.
Finally end users(me,you ...etc) are using the applications. Here client( is earning the money because of using the application (IRCTC).
If application is opening after 20 min , no end user will use the application.This problem will solved by doing Performance testing before releasing the application to the product.This is main use of doing performance testing.
Other reasons are:
1. Finding development issues like
a. Memory leaks
b. Synchronization points
c. Slow queries ....etc.
2.Administrator issues like
a. High CPU Utilization
b. High Memory Utilization
c. Connection pool issues
d. Socket issues and ...etc.
3. Architecture issues like
a. Poor db design
b.Poor software identifications .. etc.
When was performance testing starts?
Functional testing should over and Build should stable for doing performance testing.
Types of Performance Testing and which testing are followed by another testing.
For any application , it is recommended to do below performance testings
1. Base line test followed by
2. Bench mark test followed by
3. Load testing followed by
4. Stress testing followed by
5. Endurance Testing/Longevity Testing/Soak testing. We have other performance testings but these testing may/may not required
6.Spike Testing.
Note: SLA/NFR document says application needs to support with 1000 users, this is objective and Response time should be < 8 sec and CPU and Memory Utilization should be < 80%.
Base line Test: Baseline testing is nothing but one user test.
Why Base line test require/why it is important?
1.which will help to identify the correctness of the test scripts and
2.check whether the application meets the SLAs (Is response tine is <8 sec and CPU and Memory Utilization are < 80%, if not raise a Bug in bug tracking tool and send a mail to manager/Lead by saying "Need to analyse the results", if yes go for benchmark testing and send the results to entire team) for a one-user load.
Below are the Performance engineering tasks:
In result analysis, if loadrunner used, check the server time if is higher (>5sec) then need to tune the queries and code. if server time is <1 sec then use response break down graphs(or go for Dynatrace Ajax tool), then find out the reason for that. i.e
1. Check Image sizes and Downloaded time
2. Check the caches (Short term cache or Long term cache)
3. DOM time
4. DNS resolution time and Wait time.
5. Java script execution time and which method is causing the issue in that script.... etc.
These values can be used a benchmark for newer versions to compare performance improvements.
Note: Insert 5 iterations in your script for result consistency in Base line test.It is recommended.
Benchmark Test: Test for at least 15–20% of the target load.
Why Base line test require/why it is important?
1.Benchmark testing helps to identify the correctness of the test scripts and
2.Tests the readiness of the system before running target load tests, otherwise servers may crash, then it is very expensive.
3.check whether the application meets the SLAs (Is response tine is <8 sec and CPU and Memory Utilization are < 80%, if not raise a Bug in bug tracking tool and send a mail to manager/Lead by saying "Need to analyse the results", if yes go for Load Test and send the results to entire team).
These values can be used a benchmark for newer versions to compare performance improvements.
Load Testing: Finding the application behavior/Testing the application with expected(100% load) load.
Don't test directly with 100% users. Because your server may crash. So start with 25% ,30%,40%,50%,75%,90% and 100% (you can go with your own numbers , it is just examples).
Why Base line test require/why it is important?
If your application meets SLA for 25% users then go for 30% otherwise raise bug and send a mail stating that " Application may support with 25% (Ex:250 users, because our goal is test with 1000 users,so 25% means 250) needs to tune the application", even share the results with all the team.Then development team/ Architect tuned the application start with 25% load, if it meet go for 30%.
Continue the same process for 30%,40%,50%,75%,90% and 100%.
Note: 3 rounds of load test required for 25% ,30%,40%,50%,75%,90% and 100%.
Stress testing:Find application behavior/Testing the application beyond the Expected load.
Don't test directly with bigger number (like 125%), go with 110% and validate the SLA, then go with 125% validate the SLA. Test the application up to SLA not met and send the report for analysis. Then send the mail as well report to the manager, this is the Capacity of the application.
Why Base line test require/why it is important?
1. The maximum number of users supported.
2. Easy to determine Short term memory leaks.
3. Easy to determine configuration issues (Like min spare , Max spare, Max client, connection timed out issues)
4. Easy to find breaking point.
Endurance Testing/Longevity Testing/Soak testing : Testing the application with expected load for longer duration(like 12 to 18 hours).
Test directly with expected load (100% load) for 12 hours.
This test is very important and mandatory before releasing the build to production, by doing this test we can find
1. Long term memory leak
2. We can find configuration issues(socket timed out, connection timed out ... etc)
3.JVM Heap size utilization issues
4. AJB connection and connection timed out issues
5. DB Connection leaks
6. DB Cursor leaks
7. DB process leaks ..... etc.
Spike testing: Testing the application by suddenly increasing the loads.
1. Base line test followed by
2. Bench mark test followed by
3. Load testing followed by
4. Stress testing followed by
5. Endurance Testing/Longevity Testing/Soak testing. We have other performance testings but these testing may/may not required
6.Spike Testing.
Note: SLA/NFR document says application needs to support with 1000 users, this is objective and Response time should be < 8 sec and CPU and Memory Utilization should be < 80%.
Base line Test: Baseline testing is nothing but one user test.
Why Base line test require/why it is important?
1.which will help to identify the correctness of the test scripts and
2.check whether the application meets the SLAs (Is response tine is <8 sec and CPU and Memory Utilization are < 80%, if not raise a Bug in bug tracking tool and send a mail to manager/Lead by saying "Need to analyse the results", if yes go for benchmark testing and send the results to entire team) for a one-user load.
Below are the Performance engineering tasks:
In result analysis, if loadrunner used, check the server time if is higher (>5sec) then need to tune the queries and code. if server time is <1 sec then use response break down graphs(or go for Dynatrace Ajax tool), then find out the reason for that. i.e
1. Check Image sizes and Downloaded time
2. Check the caches (Short term cache or Long term cache)
3. DOM time
4. DNS resolution time and Wait time.
5. Java script execution time and which method is causing the issue in that script.... etc.
These values can be used a benchmark for newer versions to compare performance improvements.
Note: Insert 5 iterations in your script for result consistency in Base line test.It is recommended.
Benchmark Test: Test for at least 15–20% of the target load.
Why Base line test require/why it is important?
1.Benchmark testing helps to identify the correctness of the test scripts and
2.Tests the readiness of the system before running target load tests, otherwise servers may crash, then it is very expensive.
3.check whether the application meets the SLAs (Is response tine is <8 sec and CPU and Memory Utilization are < 80%, if not raise a Bug in bug tracking tool and send a mail to manager/Lead by saying "Need to analyse the results", if yes go for Load Test and send the results to entire team).
These values can be used a benchmark for newer versions to compare performance improvements.
Load Testing: Finding the application behavior/Testing the application with expected(100% load) load.
Don't test directly with 100% users. Because your server may crash. So start with 25% ,30%,40%,50%,75%,90% and 100% (you can go with your own numbers , it is just examples).
Why Base line test require/why it is important?
If your application meets SLA for 25% users then go for 30% otherwise raise bug and send a mail stating that " Application may support with 25% (Ex:250 users, because our goal is test with 1000 users,so 25% means 250) needs to tune the application", even share the results with all the team.Then development team/ Architect tuned the application start with 25% load, if it meet go for 30%.
Continue the same process for 30%,40%,50%,75%,90% and 100%.
Note: 3 rounds of load test required for 25% ,30%,40%,50%,75%,90% and 100%.
Stress testing:Find application behavior/Testing the application beyond the Expected load.
Don't test directly with bigger number (like 125%), go with 110% and validate the SLA, then go with 125% validate the SLA. Test the application up to SLA not met and send the report for analysis. Then send the mail as well report to the manager, this is the Capacity of the application.
Why Base line test require/why it is important?
1. The maximum number of users supported.
2. Easy to determine Short term memory leaks.
3. Easy to determine configuration issues (Like min spare , Max spare, Max client, connection timed out issues)
4. Easy to find breaking point.
Endurance Testing/Longevity Testing/Soak testing : Testing the application with expected load for longer duration(like 12 to 18 hours).
Test directly with expected load (100% load) for 12 hours.
This test is very important and mandatory before releasing the build to production, by doing this test we can find
1. Long term memory leak
2. We can find configuration issues(socket timed out, connection timed out ... etc)
3.JVM Heap size utilization issues
4. AJB connection and connection timed out issues
5. DB Connection leaks
6. DB Cursor leaks
7. DB process leaks ..... etc.
Spike testing: Testing the application by suddenly increasing the loads.
Monday, March 5, 2012
Causes for websites slow?
1. A client first needs to determine the IP address and port number of the web server from the URI. If the hostname in the URI was not recently visited, it may take tens of seconds to convert the hostname from a URI into an IP address using the DNS resolution infrastructure.
Luckily, most HTTP clients keep a small DNS cache of IP addresses for recently accessed sites. When the IP address is already "cached" (recorded) locally, the lookup is instantaneous. Because most web browsing is to a small number of popular sites, hostnames usually are resolved very quickly.
2. Next, the client sends a TCP connection request to the server and waits for the server to send back a connection acceptance reply. Connection setup delay occurs for every new TCP connection. This usually takes at most a second or two, but it can add up quickly when hundreds of HTTP transactions are made.
3. Once the connection is established, the client sends the HTTP request over the newly established TCP pipe. The web server reads the request message from the TCP connection as the data arrives and processes the request. It takes time for the request message to travel over the Internet and get processed by the server.
4. The web server then writes back the HTTP response, which also takes time.
The magnitude of these TCP network delays depends on hardware speed, the load of the network and server, the size of the request and response messages, and the distance between client and server. The delays also are significantly affected by technical intricacies of the TCP protocol.
Thursday, February 23, 2012
How web browser communicates with web server?
Here are the steps:
(a) The browser extracts the server's hostname from the URL.
(b) The browser converts the server's hostname into the server's IP address.
(c) The browser extracts the port number (if any) from the URL.
(d) The browser establishes a TCP connection with the web server.
(e) The browser sends an HTTP request message to the server.
(f) The server sends an HTTP response back to the browser.
(g) The connection is closed, and the browser displays the document.
Below is the Example:

What is web server? What is the Use of Web server?
Web server is a server, it handles HTTP protocol. When web server receive the http request (Ex http://gmail.com), it respond with an http response, such as sending back an HTML page.

In detail below is the example for http request and Http response

Uses of Web server:
1. Reduce the traffic to App server (all static data can handled by Web server only business logic should go Application server)
2. Most secure because it captures the end user system information like
a. IP address,
b. Browser information (which browser),
c. what request user sent
d. which OS end user using and
e. Date and Time
Examples for web server:

Examples for web server:
Wednesday, February 22, 2012

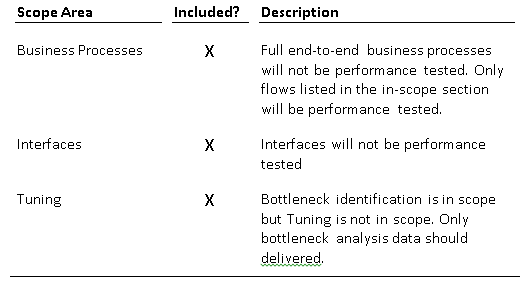

What is performance testing scenario ? What it contains.
Scenario: A scenario describes the events that occur during a testing session. A
scenario includes a list of machines on which Vusers run, a list of scripts that
the Vusers run, and a specified number of Vusers or Vuser groups that run
during the scenario.
We creates the scenario depending on NFR document/SLA. In NFR/SLA contains the what are all performance testing type need to do.
Below are the high-level business scenarios:
Scenario 1: Performing light load testing on the following scenarios with the load distribution shown below.
Script 1: With 33 % load
Script 2: With 67% load

Scenario2: Performing Load testing on the below scenarios with 100 users, with the load distribution shown below.
Script i: with 33 % load of 100 Virtual users
Script ii: With 55% load of 100 Virtual users
Script iii: With 12% load of 100 Virtual users with the below scenario settings
Ramp up: Every 2 for 4 sec
Ramp down: Stop every 5 users for 10 sec
Duration: 2 hours
Think time: 14 sec
Pacing: 9 sec
With the following ramp-up and ramp-downs:
a. Ramp up and stay at max users for few hours (Fig - 2)
b. Single hump, ramp up, stay at max users for few hours, and then ramp down (Fig ‑ 3)
c. Multiple humps during ramp up / ramp down (slowly ) (Fig - 4)
d. Spikes, multiple ramp up / down within short interval of time (Fig - 5)


Scenario 3: Performing the Peak Load test on the below scenarios between 8 AM to 11 AM and 12:30 PM to 4 PM with 100 users, with the load distribution shown below.
Script i: with 33 % load of 100 Virtual users
Script ii: With 55% load of 100 Virtual users
Script iii: With 12% load of 100 Virtual users with the below scenario settings
Scenario 4: Perform the longevity test for Scenarios 1 and 2 for longer duration with the following settings.
Ramp up: Every 2 for 4 sec
Ramp down: Stop every 5 users for 10 sec
Duration: 18 hours
Think time: 14 sec
Pacing: 9 sec
Scenario 5: Perform the load test for Scenarios 1 and 2 with rendezvous point (concurrent users) with 10 users.
Ramp up: Every 2 for 4 sec
Ramp down: Stop every 5 users for 10 sec
Duration: 1 hour
Think time: 14 sec
Pacing: 9 sec
Scenario 6: Perform the Stress test for Scenarios 1 and 2 beyond the SLA for Scripts I and II.
Ramp up: Every 3 for 7 sec
Ramp down: Stop every 5 users for 10 sec
Duration: 2hour
Think time: 14 sec
Pacing: 9 sec
 Scenario 7: Performing the spike test on the below scenarios with 100 users, with the load distribution shown below.
Script i: with 33 % load of 100 Virtual users
Script ii: With 55% load of 100 Virtual users
Script iii: With 12% load of 100 Virtual users with the below scenario settings

Performance testing Execution approach
Performance testing approach:
Before deployment to production, at least three cycles of load tests followed by a stress test and endurance test (at least for 12 hours) will be planned. Baseline and benchmark testing will be performed before load, stress, and endurance testing.
Approach
Steps 1 – Baseline Test: For the application, irrespective of time availability, performance testing will start with baseline testing. Baseline testing is nothing but one user test, which will help to identify the correctness of the test scripts and check whether the application meets the SLAs (Service Level Agreements) for a one-user load. These values can be used a benchmark for newer versions to compare performance improvements.
Step 2 – Benchmark Test: Next is the benchmark test for at least 15–20% of the target load. Benchmark testing helps to identify the correctness of the test scripts and tests the readiness of the system before running target load tests.
Step 3 – Load Test: Always plan to run at least three rounds of load test. Despite doing a slow ramp-up, it’s advisable to have three individual load tests for 50%, 75%, and 100% of the target load. (The load level should be defined based on system performance rather than just 50%, 75%, and 100% target load levels.)
Test Scenario – Have a slow ramp-up, followed by a stable period for at least an hour, and then ramp down. During the stable period, the target user load needs to perform various operations on the system with realistic think times. All the metrics measured should correspond only to the stable period and not the ramp-up/ramp-down period. Transaction response time should not be concluded based on only one or two iterations. The server should be monitored for a minimum of five iterations at the same load level before concluding the response time metrics because there could be some reason for higher/lower response time at any given time. That is why it is advisable to watch server performance for at least five iterations at the same load level (during stable load period) and use the 90th percentile response time to report the response time metrics.
Step 4 – Stress Test: Load tests should be always followed by stress tests. Based on the load test results, slowly increase the server load step by step to determine the server break point. For this test, realistic think time settings and cache settings are not required, as the objective is to know the server break point and how it fails.
Step 5 – Endurance Test: Endurance (stability) tests need to be run at least for 10–12 hours to identify the memory bottlenecks. They need not be run for peak load but it can be run for average load levels.
Jprofiler Configuring for Jboss application server and Jboss portal server
Jprofiler Configuration for Jboss Application server
For profiling your application you required two Jprofiler softwares
1. Is for Agent (Agent sit in Application server for collecting the profiling counters which may be any Linux/Unix machines)
2. Is for Monitoring collecting data (which is having GUI and sits on any Windows machine)
Note: It is possible to monitor your application from one Jprofiler but we require
a. GUI for that Linux machine (Now day mostly all Unix/Linux are in CLI interface, so we just installing agent in Unix/Linux machines and monitoring from windows machine)
b. It is not recommended because Jprofiler uses Java flat form and your Application server require Java flat form then it is difficult to profile the application)
Agent Configuration:
Step 1: Open the following URL http://www.ej-technologies.com/download/jprofiler/files.html and download the suitable Jprofiler and Place this in your Unix/Linux machine (assume you placed this in /opt)
Or
Open the following URL http://www.ej-technologies.com/download/jprofiler/files.html and right click on suitable Jprofiler and select the “Copy link address”. Then open the server using putty (cd /opt) and enter the following command wget –c http://download.ej-technologies.com/jprofiler/jprofiler_linux_7_1.tar.gz (paste the copied link here)
Note: Use following commands in your putty session for finding suitable version
Cat /proc/*release
Step 2: If your file extension is tar.gz the do the following commands for extraction
gunzip filename
tar filename
Step 3: In Linux machine open .bash_profile file (usually located in /root directory)
Enter jprofiller location (using export command) in .bash_profile file
export JPROFILER_HOME =/opt/jprofiler6/bin/linux-x86
Step 4: Open run.conf from Jboss_Home/bin then add the below content in the run.conf file
JAVA_OPTS="$JAVA_OPTS -agentpath:/opt/jprofiler6/bin/linux-x86/libjprofilerti.so=port=8849 -Xbootclasspath/a:/opt/jprofiler6/bin/agent.jar"
Monitoring the Profiling Data from Windows machine :
Step 1: Install the Jprofiler in windows machine (agent version and this version should be same)
Step 2: From ‘Quick Start‘ Screen select “An application on a remote computer” option and click on next button
Step 3: From the Wizard select “On remote computer” and select which OS your app server /agent is running and click on next
Step 4: From JVM Vendor , version . Select which vendor JVM using , version and click on next
Step 5: Select “wait for a connection From the Jprofiler GUI”
Step 6: Start your jboss now from your putty
Preconditions:
1. JRE required
2. Jboss server need to Stop before configuring the agent
3. License key required in Windows environment (Agent does not required license key)
Tuesday, February 21, 2012
Jpofiler Configuration in Tomcat App server
Jprofiler Configuration for Jboss Application server
For profiling your application you required two Jprofiler softwares
1. Is for Agent (Agent sit in Application server for collecting the profiling counters which may be any Linux/Unix machines)
2. Is for Monitoring collecting data (which is having GUI and sits on any Windows machine)
Note: It is possible to monitor your application from one Jprofiler but we require
a. GUI for that Linux machine (Now day mostly all Unix/Linux are in CLI interface, so we just installing agent in Unix/Linux machines and monitoring from windows machine)
b. It is not recommended because Jprofiler uses Java flat form and your Application server require Java flat form then it is difficult to profile the application)
Agent Configuration:
Step 1: Open the following URL http://www.ej-technologies.com/download/jprofiler/files.html and download the suitable Jprofiler and Place this in your Unix/Linux machine (assume you placed this in /opt)
Or
Open the following URL http://www.ej-technologies.com/download/jprofiler/files.html and right click on suitable Jprofiler and select the “Copy link address”. Then open the server using putty (cd /opt) and enter the following command wget –c http://download.ej-technologies.com/jprofiler/jprofiler_linux_7_1.tar.gz (paste the copied link here)
Note: Use following commands in your putty session for finding suitable version
Cat /proc/*release
Step 2: If your file extension is tar.gz the do the following commands for extraction
gunzip filename
tar filename
Step 3: In Linux machine open .bash_profile file (usually located in /root directory)
Enter jprofiller location (using export command) in .bash_profile file
export JPROFILER_HOME =/opt/jprofiler6/bin/linux-x86
Step 4:Go Tomcat installation directory. Open catalena.sh file from bin folder
Enter the below details in catelana.sh file (only red color information and black color you can find by default in catalena.sh file)
export JPROFILER_HOME
JAVA_OPTS="-Xms768m -Xmx1024m -XX:PermSize=256m -XX:MaxPermSize=256m -Dfile.encoding=UTF8 -agentpath:/opt/Performance/jprofiler7/bin/linux-x86/libjprofilerti.so=port=8849"
Monitoring the Profiling Data from Windows machine :
Step 1: Install the Jprofiler in windows machine (agent version and this version should be same)
Step 2: From ‘Quick Start‘ Screen select “An application on a remote computer” option and click on next button
Step 3: From the Wizard select “On remote computer” and select which OS your app server /agent is running and click on next
Step 4: From JVM Vendor , version . Select which vendor JVM using , version and click on next
Step 5: Select “wait for a connection From the Jprofiler GUI”
Step 6: Start your jboss now from your putty
Preconditions:
1. JRE required
2. Jboss server need to Stop before configuring the agent
3. License key required in Windows environment (Agent does not required license key)
Subscribe to:
Posts (Atom)