Monday, April 30, 2012

What is 90 percentile

90 percentile is average of 90% of the response times, here arrange the 100 response times from good to bad then eliminate the worst 10% of the response times. Then calculate the average for 90% of the response times.

Example: The response times for an application for 10 users is
2,4,3,8,9,16,6,8,3,10 then arrange them from Good to bad 

2,3,3,4,6,8,8,9,10,16 

Then take the average for 90% of the response times 2,3,3,4,6,8,8,9,10 (eliminate the 16) is 5.88.
Overall (100%) response time is 10.94

Why 90 percentile required:
End users need to satisfy with the application response time / speed. Then users should increase other wise users won't use that application. For satisfaction calculation purpose Performance testers uses the 90 percentile. Means 90% of the users satisfying with that response time, remaining 10% users not satisfying with that response times.

Monday, April 23, 2012

Performance test plan template

Please find the performance test plan template in following link performance-test-plan-Template

Thursday, April 19, 2012

Check list for performance testing scripting

For making script reusable, error free and easy to understand, performance tester need to follow scripting standards. Due to this test can eliminate the scripting errors 

Performance Test Plan


For any project performance test plan is very important. In PLANNING phase we can create the performance plan and finalize the plan. Please see the performance plan below 

Tuesday, April 17, 2012

Entry&Exit criteria for performance testing and Entry&Exit criteria for performance execution phase

For any application the Entry criteria and Exit criteria may same.Because if application is not satisfying the performance objectives or goals then performance testing should not complete for any project like this with out (entry criteria) performance goals it is not possible to start the performance testing for any project.
Without performance goals doing performance testing is use less.

Performance testing Entry and Exit criteria:

Entry Criteria: Well defined SLA/Performance Objectives/Performance Goals
Exit Criteria: All performance SLA/Performance Objectives/Performance Goals should be met.


Performance Execution phase Entry and Exit criteria:
Entry Criteria: 1. Build/application should be stable (stable means functionality should be well and good, not functionality bugs should exits)
2.Performance testing environment should be ready
3.Scripts should be ready
Exit Criteria:Performance execution should be finished with out any transaction failures.


Thursday, April 5, 2012

Tell about your self.


1) Tell about your self?
Ans: 
About my Experience:This is Madhu sudhana, have 7 years of experience in Performance Testing and Manual testing,  4.6 years of experience in area of Load runner , 3.2 years of experience in Performance engineering, 2 years of experience in Web server and Application server tuning and 1 year of experience in DB tuning.
About my current Project: I am now working XXX project from 2011 Feb to till. This project need to support 10,000 users and performance oblectives are response time shoulod be < 4 sec, Hits per second should be 18 hits/sec, CPU and memory utilization should be < 80%.

Roles & Responsibilities :
Role is Lead engineer 
Responsibilities are 
  In my company performance testing approach is as follows 
   Step 1: We will send the project proposal to client once client satisfied we will get the project (in this phase my manager and lead involves)
Step 2: We will gather the requirements from client, here requirements means total number of users the application needs to support, response times, Hits per second, CPU utilization and Memory utilization.
If client does not provided this we can go with industry standards like Response time should be < 6 sec and CPU and Memory utilization should be < 80%.
Step 3: Identify the Business transactions (Gmail business transactions are login, inbox, compose mail, log out these are all transactions)  and
  Work load Models (How user doing navigation in that Gmail, Ex:  Login (1 time)-->Inbox (8 times, means in average every users check 8 mails so insert the loop/iterations here instead of creating script for 8 times mail checking)-->Compose mail (5 times)--> logout (1 time)).
Identifying business transactions are 3 ways:
 1.Client will give business transactions and work load models , if not below 2 ways need to follow
 2. If the Application is in Production --> Identifying  business transactions and work load models from logs: How?
      In my project we are using Apache Http server as web server, we are taking 6 months access_logs from apache and Parsing the logs using 123logAnalyser and DeepLogAnalyser. From that we are taking most used transactions and Work load models.
3.If the Application is in not in Production -->For  Identifying  business transactions and work load models we are using 2 Techniques
    a. Heavy throughput : Transaction which are handling more data(like searching , opening email)/transaction which are getting more data from the server and displaying them in browser.
    b. Machine Critical techniques: Tracsction which are critical to the application (like Deposit, Withdraw,Composing mail, Pay bills......)

Step4: Creating the script for identified transactions (identified transactions in step 3) and Creating the scenarios(see the scenarios in following linkhttp://madhuanilreddy.blogspot.in/2012/02/high-level-business-scenarios-for.html )for identified workload models.
Step5: Execution the performance testing  scenarios (See the execution process in following link  http://madhuanilreddy.blogspot.in/2012/02/performance-testing-approach.html)

Step 6: Send the results to the manager and lead

Difference between Correlation & parameterization?

No comparison between these two. Because correlation is capturing dynamic values from server and Parameterization is  passing multiple values to the server.

See few differences

---------------------------------------------------------------------------------------------------------------
                              Correlation                                                                Parameterization
---------------------------------------------------------------------------------------------------------------
1.Finding the Dynamic values in server response       1. Passing multiple values to the server
and passing the value in the script
2.These values comes from server automatically       2. These values user need to took from data base manually
3. Tester doesn't know these values                         3. Tester know these values.
4. Correlation is mandatory                                     4. This not mandatory but it is recommended
--------------------------------------------------------------------------------------------------------------                                               

Wednesday, April 4, 2012

What is Correlation?

Performance testing is iteration process means create script for one real user and run the script for huge or many users. How server identifies the each user actions for multiple users, for this server creates an UNIQUE USER SESSION for every user. Using this session user can perform this actions or transactions. Once user signout from application , once again server creates new session for the same user. So for each user has unique sessions.

We created a script for real one user, so script records the unique session id in the script. If i am running second time script uses the recorded session id due to this script will throw error. So we need to change the dynamic values (like session Id) each user, this is called correlation. In computer science terminology making "constant" value to "variable".

Correlation is capturing the dynamic values from the server then passing that value to the script.

Tuesday, April 3, 2012

URL and PORT parametrize using JMeter


Scripts should be reusable means if client want to execute the script in QA environment then scripts should be run in QA environment and client want to run in SIT environment then scripts shold be run in SIT environment. For this performance tester is able to parametrize the Application URL and Port numbers.
If QA environment URL : http://staging.qa.com then just change the URL in parametrize file
If QA environment URL : http://staging.sit.com then just change the URL in parametrize file

So our script is reusable in any environment by doing parametrize.

For this we are using pre processor (User Parameter)

Step 1: Start Jmeter from jmeter.bat , In Jmeter UI should open then Add Thread group to "Test Plan"
               Test Plan--> Thread Group


Step 2: Add HTTP Request to Thread Group
              Thread Group--> Sampler--> Http Request
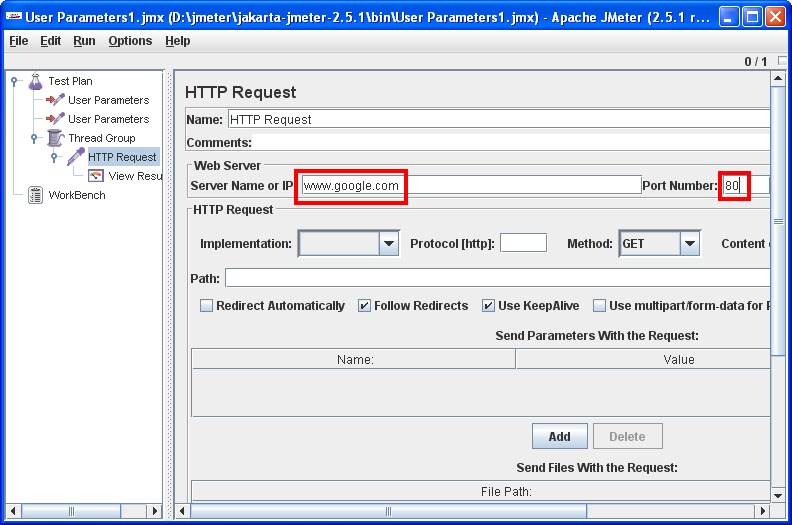
  Step 3: Add URL and Port to "HTTP Request"
                 Here URL : www.google.com
                           Port: 80


Then Start Parameterizing URL and PORT, see how to parameterize below 
Step 4:Add user parameter to the test plan 
                        Test Plan-->Pre processors--> User Parameters

Add two variables 'url' and 'port' to user parameters pre processor, shown below
Note: Add this just above to "Thread Group"

Step 5: Add 'url' and 'port' variables to the HTTP request samplers. Shown below

Step6: Verify whether these values are going or not from "View Results Tree"

What is parametrization? Why Parameterization required?


Parameterizing is direct impact on performance test results, if performance tester not parameterize the script then response times should vary. Many of the performance tester are not doing parameterize during performance testing this is not at all recommended. Because performance testing should be realistic, so performance tester need to thing as end user of the application. Then application goes well in production.

What is parametrization?

Parameterization: Passing multiple values to the server is called Parameterization.

Why Parameterization required?
1.Through the use of different parameter values, you can avoid database caching. Means
If we send same user name & password multiple times to a website , Data base server keep the details in Buffer and fetch the information from the buffer due to this response times are not realistic. Beacuse in real world scenario each user logins with unique user credentials, so data should be fetch from DB data files(hard disk) not from buffers.
   In  Oracle most recent data kept in Buffer, so if  user login and performed some activities, oracle kees the information in Buffer(DB block buffer), if i loged in scecond time data should get from buffer.
2.Your application might not allow a user to be logged on more than once simultaneously.
3. For mitigating realist scenario means in real word users are login with different ids but in our script we are login with same Id for different users. this is not real world scenario for this using Parameterization concept we are mitigating real word scenarios

Monday, April 2, 2012

JMeter Parameterization/Parameterizing


JMeter Parameterization:

When you want to run/execute one test plan for more than one user at the same time you go for parameterization. It is a method of generalizing an action.
We can do parametrization in two ways

Method-1:
Step1:- Record a webpage(Sample/Request) having login Scenario.
Example:-www.lowcostloadtest.com

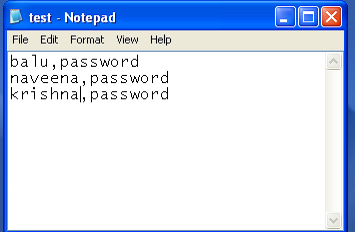
Step2:-.Now we need a CSV data file from which we will import the values that are to be parametrized.Open notepad and enter Username and Password separated by commas.


Save the file as “test.csv”.(inside bin folder)

Step3.:-Add->ConfigElement->CSV DataSet Config.Fill the fields as follows
    Filename: test.csv (give entire path, if test.csv file is not in JMeter bin folder)
    Variable names: A, B
    Delimiter: ,
     Recycle: true
     Stop: false


Note : If test.csv file is out side the JMeter bin , please provide the entire path in FileName filed of the above screenshot. If test.csv file is in JMeter bin directory no need to provide entire path.

Note:-You can give the variable names as you wish.(like A,B).The variable names are reference  inside the sample.

Step4:- Open the login sample(request).Goto ‘Send parameter with the request’ section
Now change the value of login  field to : ${A} 
and value of Password field to : ${B}
Here A and B are the variable names set in CSV Data Set config.


Step5:-.make sure to set number of threads(users) accordingly.

Step6:-.Run the script and observe the result in result tree.


Method-2:  Using preprocessor (User Parameter)

Step1:Open a notepad and enter userid and password for three users.
Note:Save the file as test.csv. The extension csv makes it a comma separated Value (CSV) file should place in bin directory of the Jmeter

Step2: Select the Login sample and add a “User Parameter” from Thread Group->Pre Processors to it.


In parameters add three variables 'by clicking on 'Add Variable' and fill it as shown in below figure:

__CSVRead is a function which reads values from file test.csv . The second parameter of the function is the column number .Name is the variable name which is referenced in the request sample.

Step 3:select the login sample and change the values of userid and password to ${A} and ${B}.
Now run the script and observe the result in view result tree


JMeter correlation


Step1:-Add thread group to the testPlan.
           Name :- irctc_correlation
           Number of threads:- 1
           Loop Count:- 1

Step2:-Change the LAN settings in internet browser.
            Tools-->Internet Options-->Connections-->Click on LAN settings-->
             Select Proxy server check box.
             Address:-Local host
             Port:-8090
           
Step3:-Add Http Proxy Server to the Workbench.
            Port:-8090
            select  “Attempt HTTPS Spoofing” check box.
            Target Controller:-TestPlan-->irctc_correlation
            Click on Start button

Step4:-Enter the url address “http://www.irctc.co.in”  in address bar.
            Record the script as follow
            Login-->Logout

Step5:-Click on stop button in Http Proxy Server.

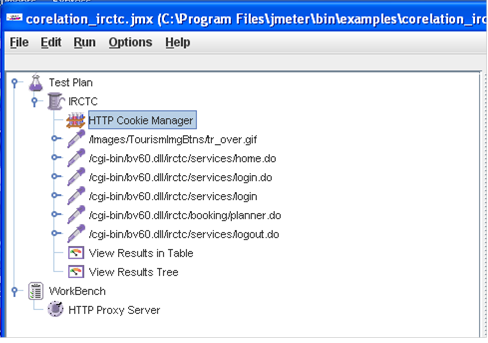
Step6:-Add Http Cookie Manager to the thread group.
           Add View Results in Table to the Thread group.
            Add View Results  Tree to the Thread group.

Step7:-When you run the script it will show session expired in the listener. (View result tree->response data in Html rendered).The result may appear in red as failure. 
          So we should correlate the script with HTTP URL Rewriting Modifier.

   Step8:-we  observe the following BV_SessionID and BV_EngineID in http requests.


Step9:-Add  two HTTP URL Re writing  Modifiers  to  http requests which contains both BV_SessionID and BV_EngineID

i)Session Argument Name:BV_SessionID

ii)Session Argument Name:BV_EngineID


Note:-Don't forget to select “cache Session id?”

step9:Now change the variable values to “ * “  in the http requests.


Step10:-Save and Run the Script.Now the Result will be Successful.         


Application monitoring in Linux and Unix

During  performance testing

Disk monitoring commands for Linux and Unix


Network monitoring commands for Linux and Unix


Memory and Swap Monitoring commands for Linux and Unix


CPU Monitoring commands for Linux and Unix


Commands for System information finding

Using below commands easy to find the system information like
            Server Release info
            Server type
            Memory
            CPU
           Operating System
            Disk Drives....etc.


Unix/Linux monitoring commands?

System Information : Displaying system information like CPU,Memory... etc.
Memory and Swap:
Disks:
File systems and Devices:
Networking:
Crash Dump
Kernel Modules and Parameters:

Sunday, April 1, 2012

What is Interrupt cycle?

CPU/OS  is processing process p1, in process p1 there is an instruction 'read opd.txt file'. then CPU/OS gives this request to Device controller (disk controller) then disk controller  is reading the data from disk mean while CPU should not Idle, CPU context switching to process  p2 and  process p1 is preempted
1.CPU gives the request to Disk controller
2. Disk controller reads the data from disk to buffer, once reading is finished CPU raises an interrupt to OS/CPU , at that time may be P2 my running. CPU is executing the 5 instruction of the P2.
3.CPU send an IACK(Interrupt Acknowledge) to the Disk contoller. CPU will wait until completion of executing the 5 instruction of the P2. During this time no IACK should send to disk controller.
4.After receiving IACK, Device Controller sends an Interrupt Vector(set of bytes used an index for an ISR) to OS.

Every OS main the Vector Table , Vector table has Index and ISR in each row.
           |-------------------------------------------|
           |     Index             |   ISR                            |
           |------------------------------------------ |
           |  222                  |   PrinterISR                  |
           |  232                  |   DiskISR                     |
           | 342                   |   Netw.orkISR              |
           -------------------------------------------
Above one is basic view of vector Table.
ISR: Interrupt service routine is Pointer to sub routine or functions. OS is bunch of C code partially assembly language(10%).OS code is million of lines.In this millions lines handling 'Disk Activity' is a small portion, so ISR points the specific code block/function/lines for executing those lines.


5. CPU before executing the ISR for disk controller  (Ex: DiskISR), CPU do two things
    i. Saves the next instruction (Instruction 6) of the P2 in STACK or saves the next PC (program counter)
         in stack. Here saves only address of instruction 6 only because PC contain address of next instruction.
    ii.Disable the Interrupts from same disk controller
6.Executes the Disk ISR means takes the data from Disk controller buffer and place that in Physical
     memory.

Note: ISR not allowed recursion